

System Dynamics | Foundation 13: Overshoot & Collapse
The System Ate Itself

In primary school, we all got warned about the resources we use and their limits. At first glance, this seems too easy to grasp but for some reason, we generally ignore what this simple concept actually introduces.
In 1992, Canada shut down the Grand Banks cod fishery. The stock had dropped from hundreds of thousands of tons of spawning biomass to almost nothing in less than ten years. The fleet that had fished those waters for five hundred years came home and never went back. Thirty years later, the cod still haven’t recovered.
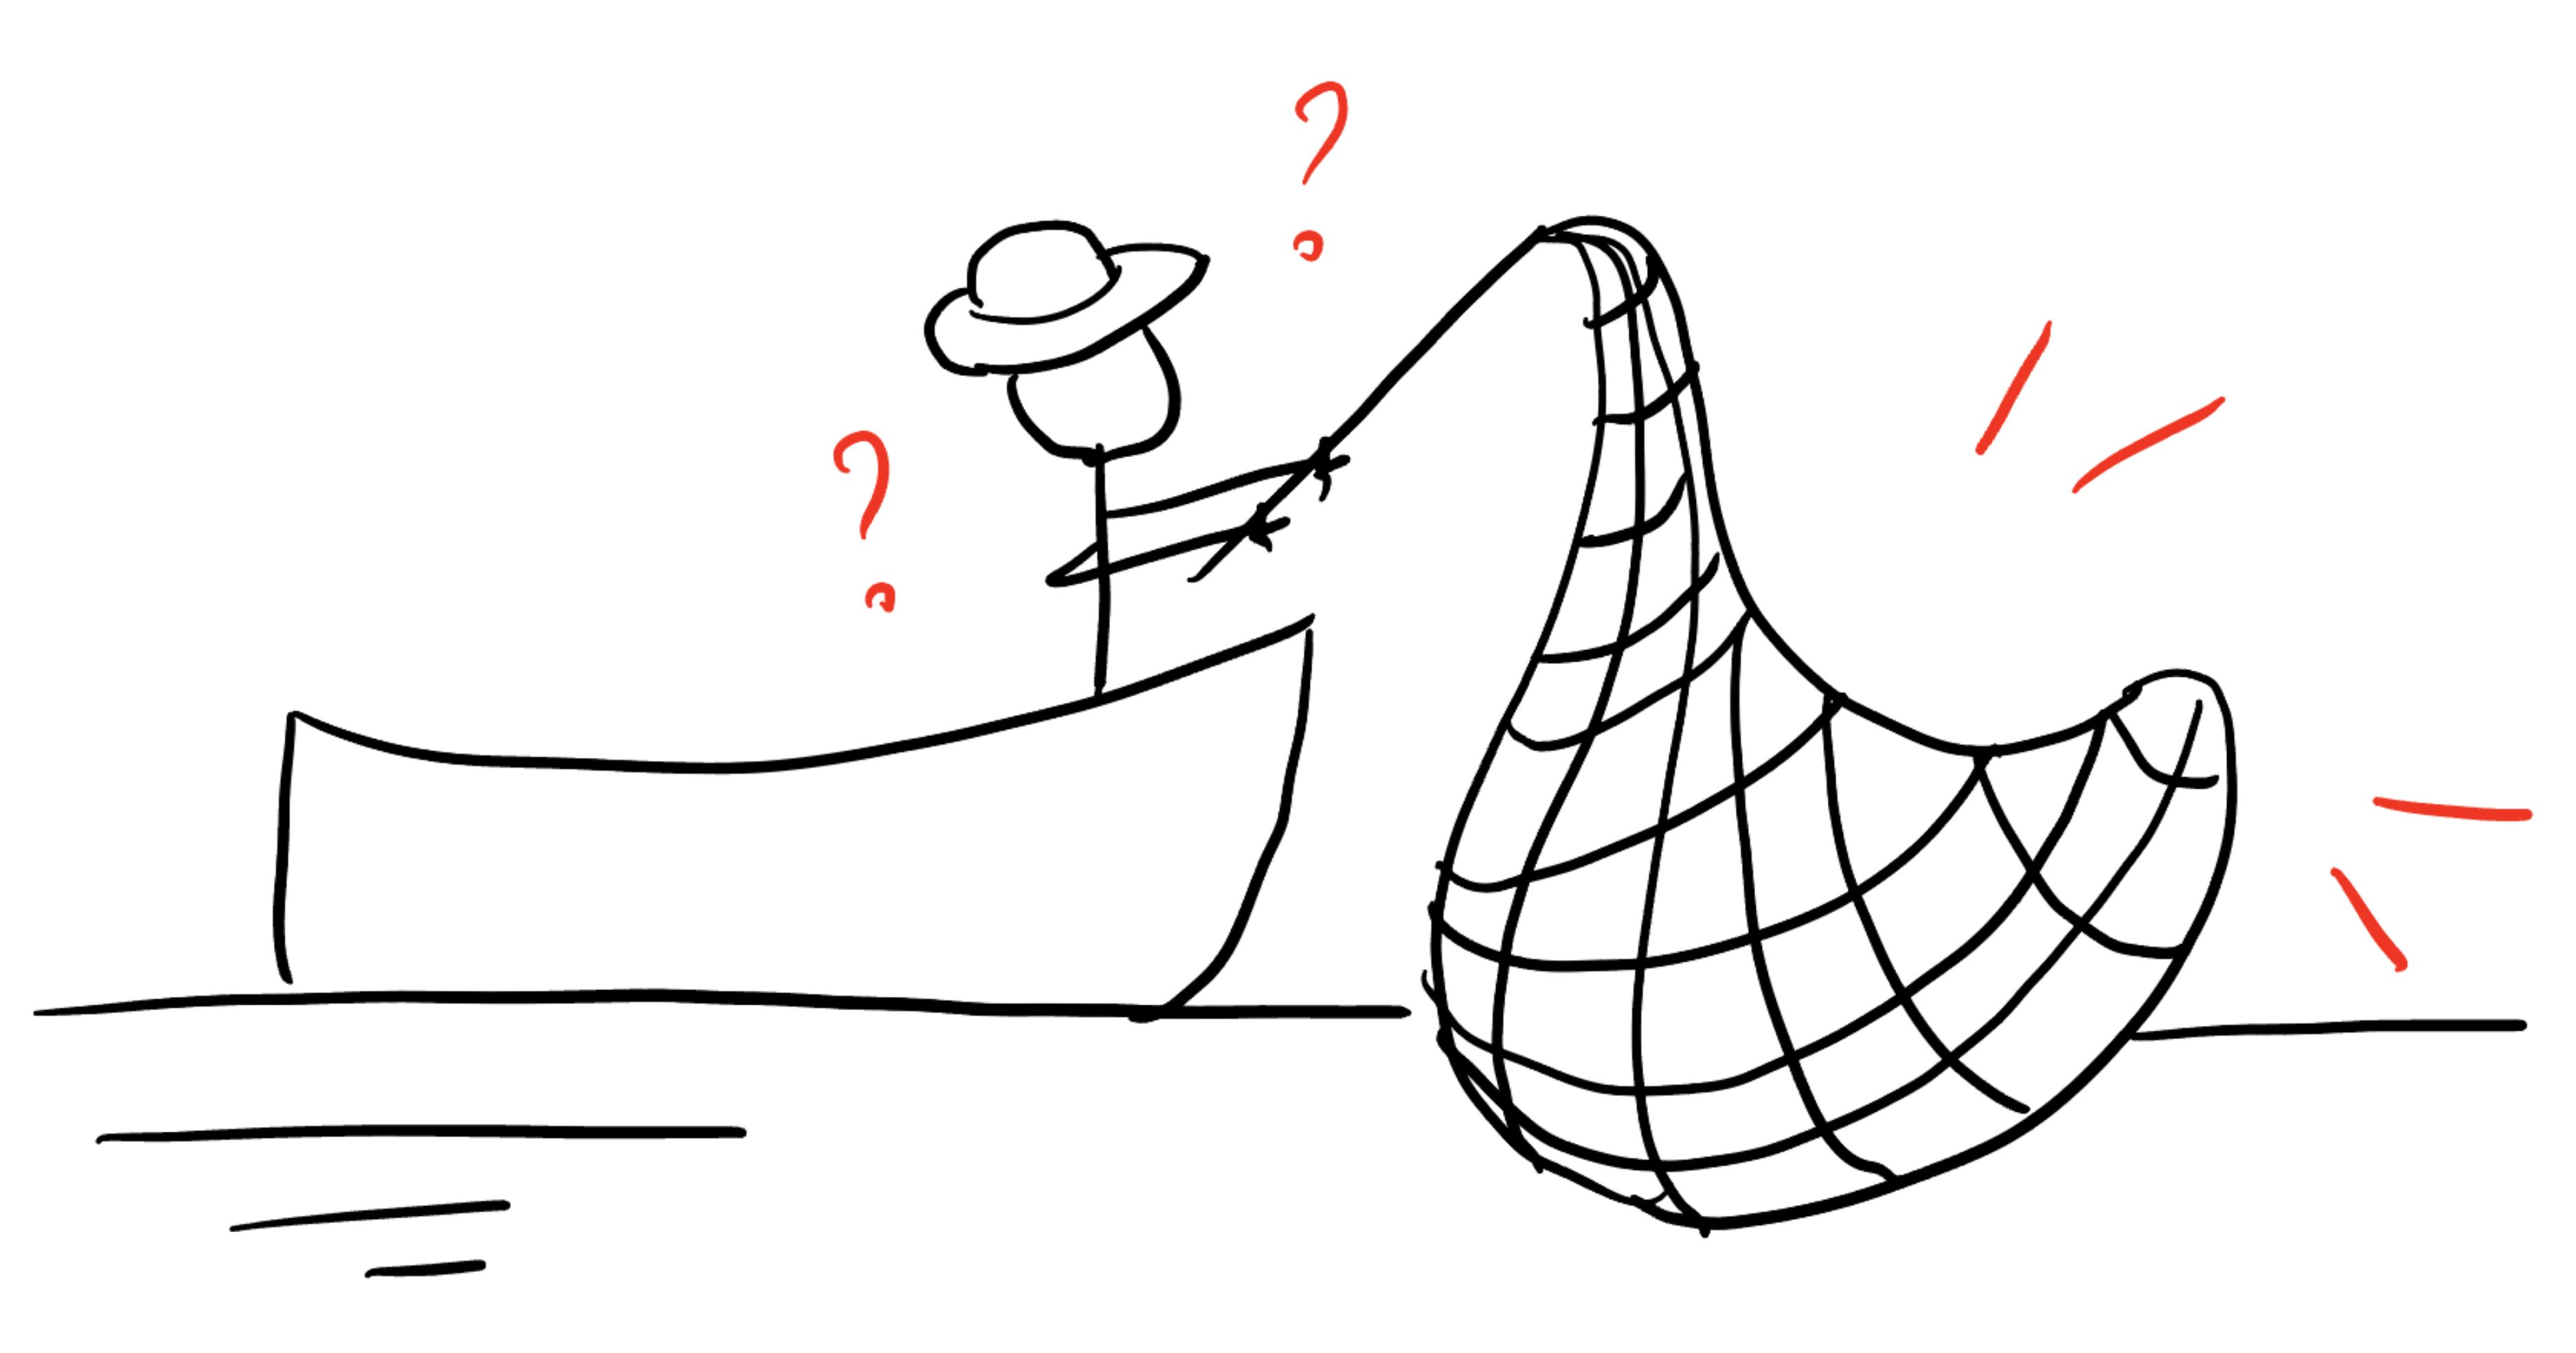
Weird enough, the catch was still good the year before the fishery closed.
This is what overshoot looks like from the inside. You’ve probably felt a version of this, not at the scale of a fishery, but in the particular exhaustion that comes not from a bad week, but from a long period of running past what you actually had. The work was getting done, you were delivering, functioning somehow. The reserve that made the delivering possible had been draining for months without you noticing. Then one day it wasn’t there, and that’s the day you feel something is off.
Your burnout is actually something else, a mechanism from a systems thinker’s point of view. Seeing it as a personal failure is utterly shallow. That’s what we call “overshoot”, a structural condition.
The Wrong Model
The common explanation for collapse is straightforward in nowadays popular culture. We think that someone made bad decisions. The cod fishery collapsed because fishermen were greedy. Easter Island deforested because the islanders were shortsighted. You burned out because you didn’t manage your time.
This explanation is comforting because it implies a simple fix. Better decisions, better people, better discipline. But this is not the answer, since we’re looking at from a wrong side.
Foundation 12 introduced two-stock systems, systems where stocks are coupled through shared flows. In the SI model, the coupling was a transfer. Every person added to Infected stock was subtracted from Susceptible stock. That produced the epidemic hump as acceleration, peak, decline.
Overshoot and collapse is the two-stock pattern that emerges when one stock consumes a resource stock it depends on for survival, and the resource stock has a regeneration rate that itself depends on how much resource remains. In other words, the consuming stock does not just deplete the resource. It is able to push the resource below a threshold where regeneration cannot work. When we past that point, the resource does not recover, neither does anything that depended on it.
It is important to notice that this is not oscillation. Foundation 11 showed what happens when a balancing loop operates on delayed information. Remember, the system overshoots its target, then corrects, then overshoots again. Oscillation is a system repeatedly missing and finding its mark. In a sense, overshoot and collapse is a system destroying the mark.
Let me repeat again since the distinction matters. In oscillation, the balancing mechanism is intact but delayed. In overshoot and collapse, the balancing mechanism depends on a resource base that gets permanently degraded. The loop doesn’t arrive late but it breaks.
The Island
Easter Island is the cleanest historical example of this structure. Two stocks, three loops, one outcome.
For backstory: Easter Island, a Chilean territory, is a remote volcanic island in Polynesia. The most striking story of Easter Island, however, is its collapse. It is one of the most extreme examples of deforestation in the world: the entire forest is gone and all tree species extinct. Evidence suggests forest harvesting started around 900 and peaked in 1400. Let’s see the structure together.
Stock 1: Population.
Inflow: births. Outflow: deaths. The population of Rapa Nui grew from a small founding group of Polynesian settlers to an estimated peak of 10,000–15,000 people.
Stock 2: Forest Cover.
Inflow: regeneration. Outflow: harvesting. The island was once densely forested with large palms. The forest provided building material, fuel, rope fiber, and critically, the canoes used for deep-sea fishing, the primary protein source.
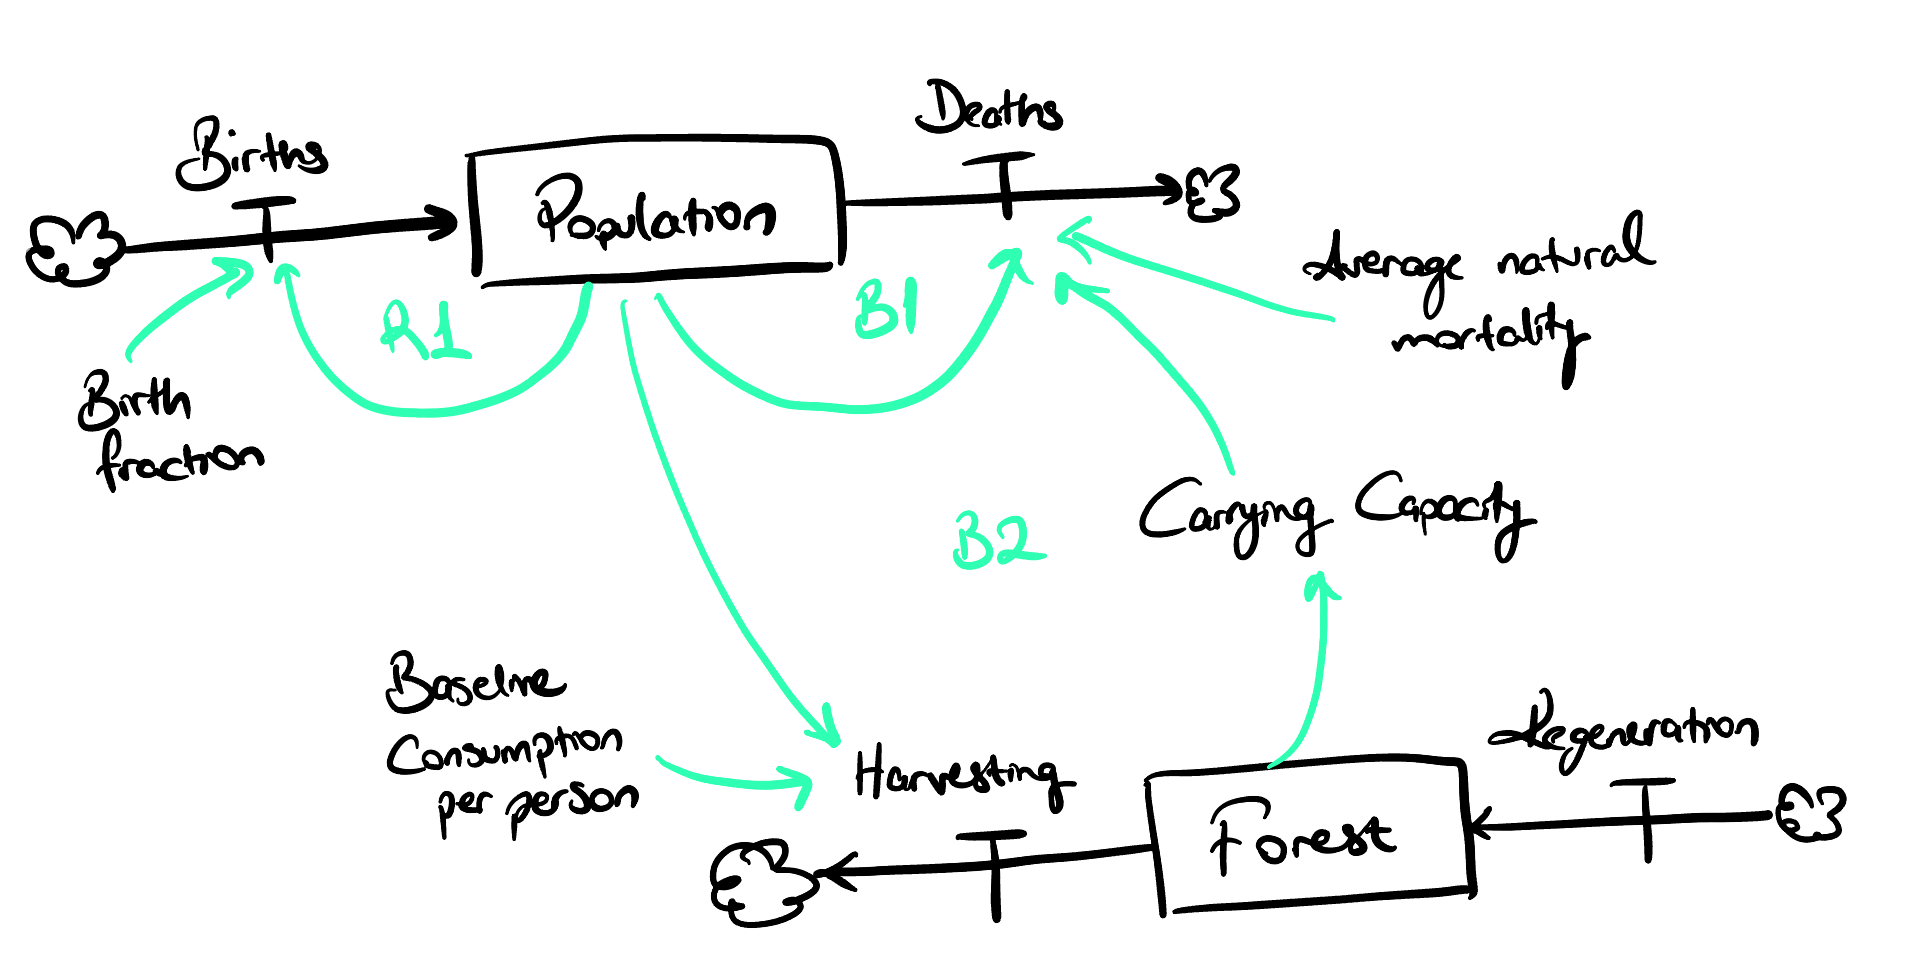
Three feedback loops govern the interaction.
R1 Population Growth (Reinforcing): More people → more births → more people. Standard demographic reinforcing loop, the one Foundation 7 catalogued. With adequate resources, R1 dominates.
B1 Natural Mortality (Balancing): More people → more deaths → fewer people. The baseline balancing loop. Under normal conditions, B1 is weaker than R1, so population grows.
B2 Resource Depletion (Balancing): More people → more harvesting → less forest → lower carrying capacity → higher death rate → fewer people. This is the structural loop that distinguishes overshoot from simple growth. B2 is a balancing loop, but it balances through destruction of the resource base, not through a corrective signal.
Now trace the sequence.
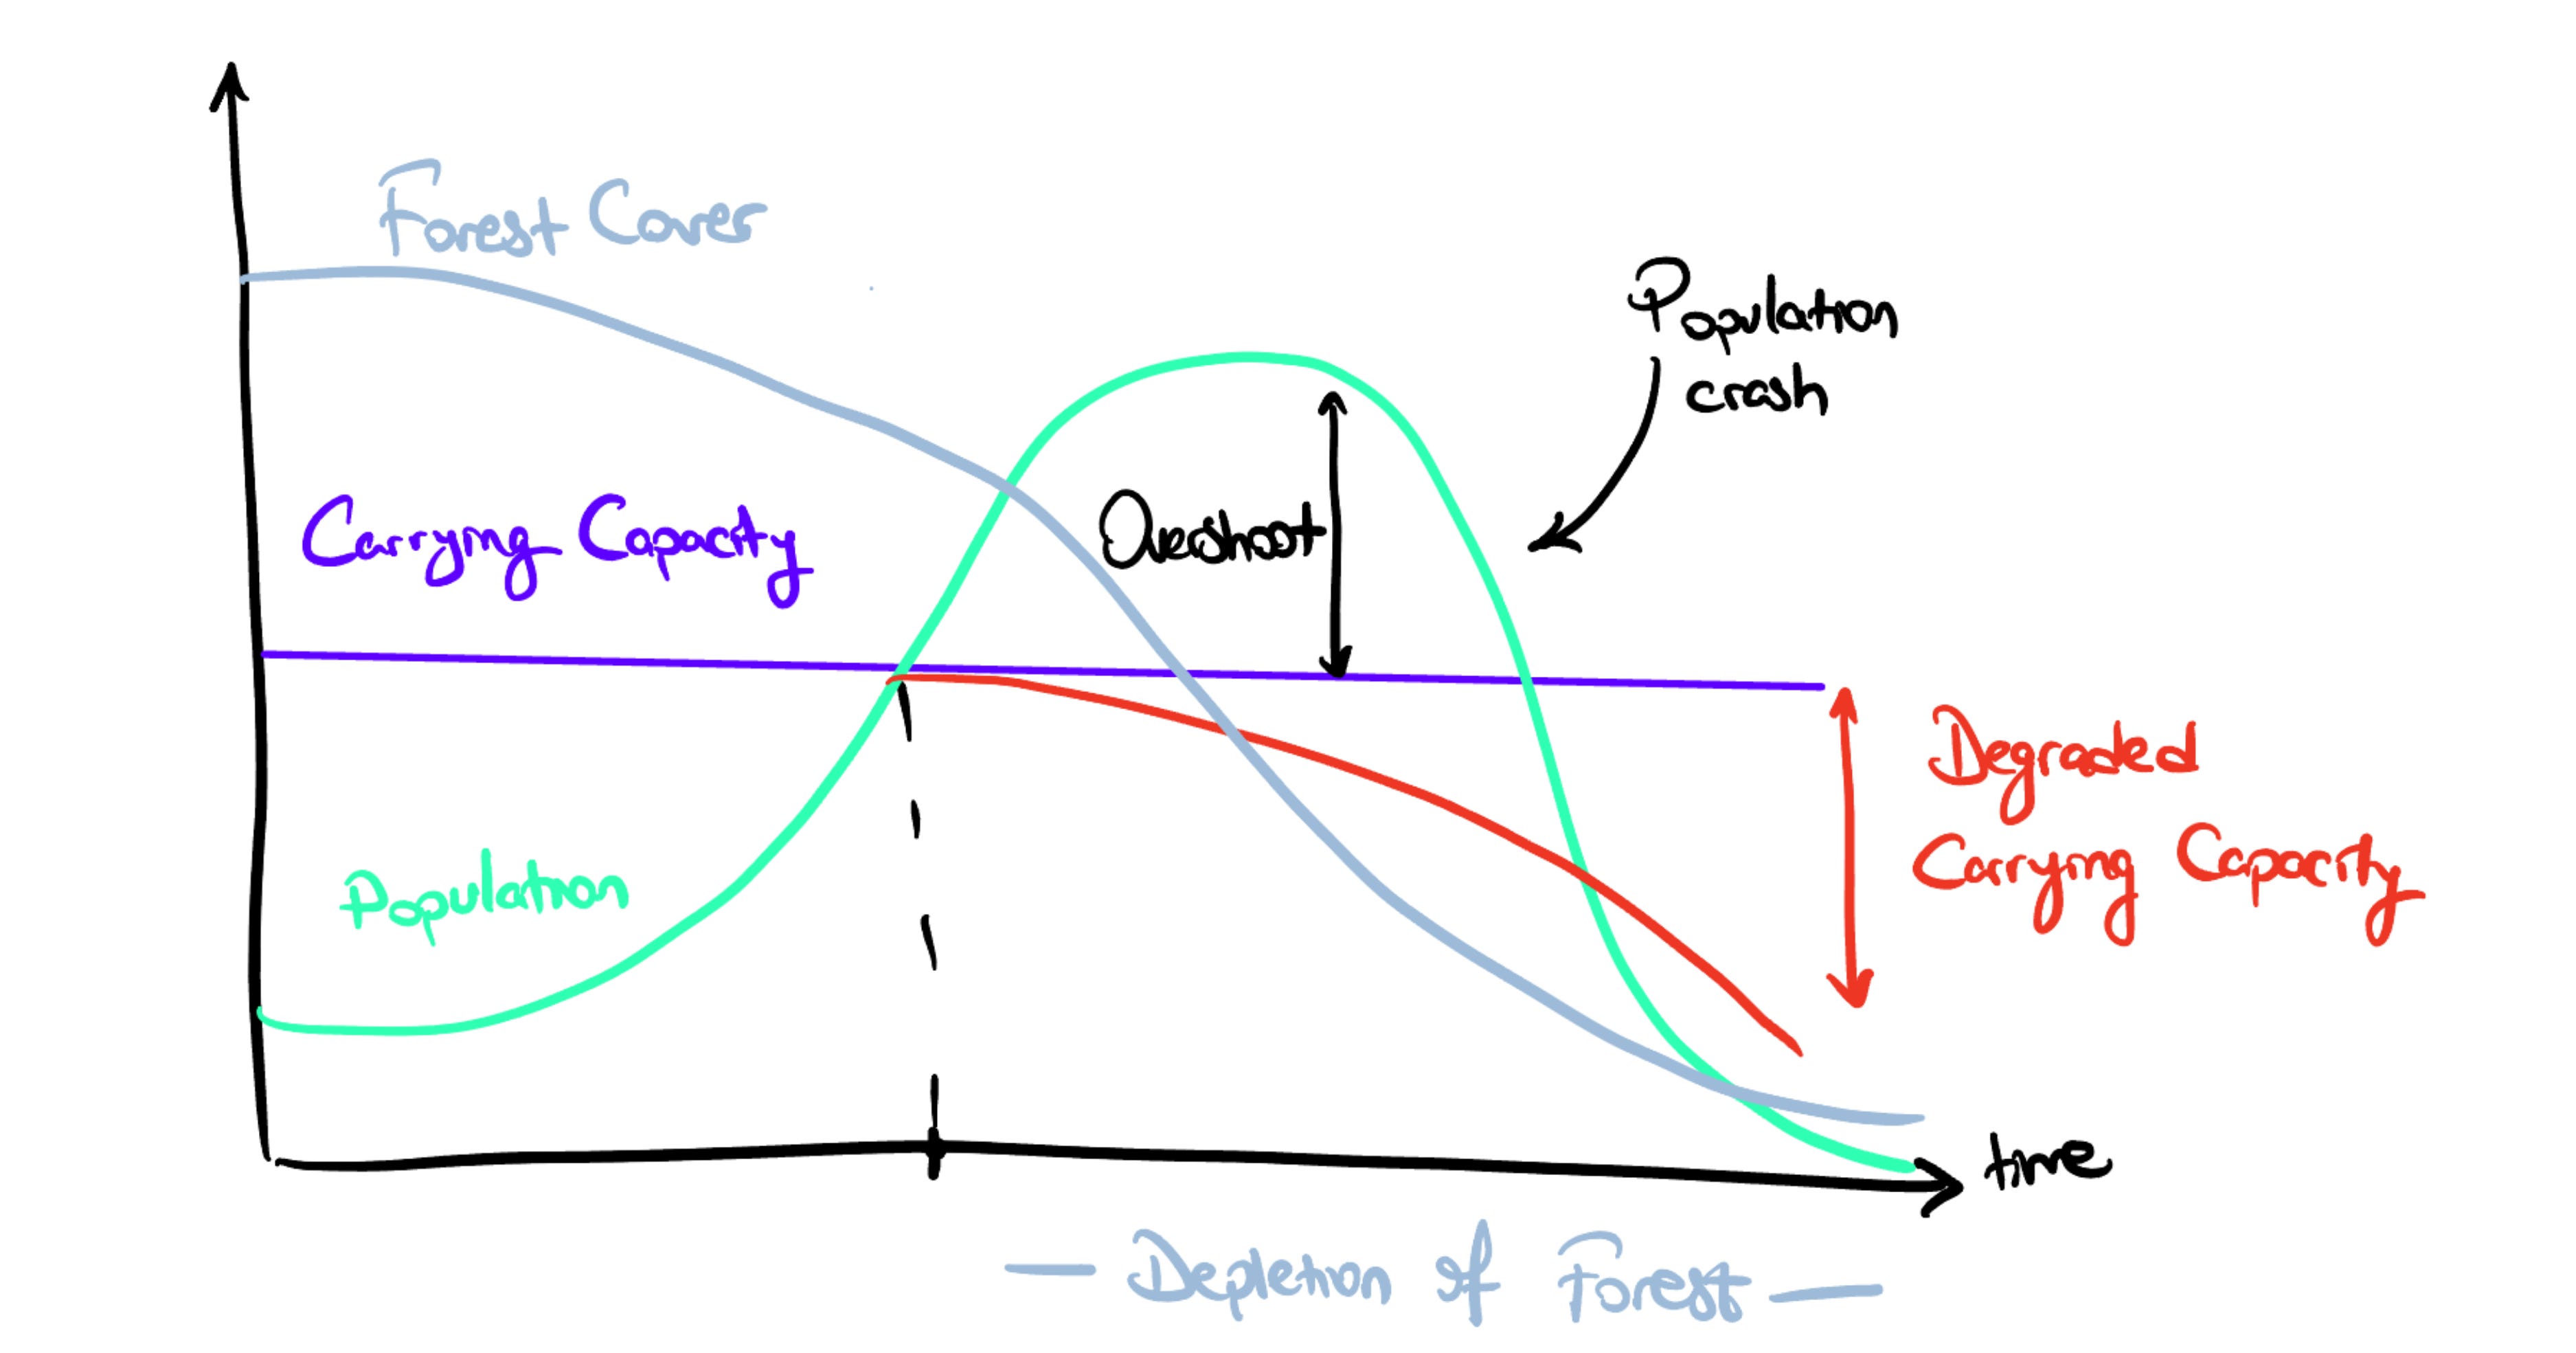
Phase 1 Growth: Population is small, forest is vast. Harvesting is negligible relative to regeneration. R1 dominates. Population grows. Forest barely notices.
Phase 2 Acceleration: Population larger. Harvesting increases. Forest begins to decline, but slowly. The decline is invisible from inside the system because the resource stock is still large enough to support everything the population needs. More canoes get built. More fish get caught. More children survive. This phase looks like prosperity. It is the system eating its capital and calling it income.
Phase 3 Drawdown: Harvesting exceeds regeneration. Forest cover drops. Notice thata regeneration is not constant, it is a critical nonlinearity. A forest regenerates as a function of its own size. Fewer trees mean fewer seeds, less canopy protection for seedlings, more soil erosion. As the forest shrinks, its ability to regrow shrinks faster. The regeneration curve is not linear, it collapses below a threshold.
Phase 4 Collapse: Forest crosses the regeneration threshold. Even if harvesting stopped entirely, the remaining forest is too sparse to recover on its own. Canoes cannot be built. Deep-sea fishing ends. The protein source disappears. Carrying capacity drops below current population. Death rate spikes. Population crashes to a fraction of its peak. The forest does not return.
The structural point is worth stating plainly. Every individual decision in this sequence was locally rational. A family that builds a canoe from the nearest tree is not being greedy. They are feeding their children with the tools available. The collapse did not require anyone to be shortsighted, selfish, or stupid. It required only that a population coupled to a regenerating resource grow faster than the resource could regenerate, and that the resource’s regeneration capacity decline with its stock level. Individual rationality, collective ruin. The structure selects the outcome.
The Mechanics
The formal condition for overshoot and collapse requires three elements operating simultaneously:
A consuming stock coupled to a resource stock: The consuming stock’s survival depends on flows from the resource stock. This is the coupling from Foundation 12, neither stock’s trajectory is independent.
The resource stock’s regeneration is stock-dependent: The resource does not regenerate at a fixed rate. Its regeneration rate is a function of its own level. Below a critical threshold, regeneration falls below any positive harvesting rate. This is the nonlinearity that separates collapse from oscillation.
The consuming stock’s growth outpaces regeneration before the signal arrives: The consuming stock grows through a reinforcing loop that is faster than the resource’s regeneration. By the time the resource constraint becomes visible, by the time B2 bites, the resource is already past the breakdown point.
The third condition explains why the dangerous period looks like success. While R1 dominates and the resource stock is above its regeneration threshold, every performance metric improves. Population grows, output increases, the system appears to be thriving. Yet, the resource stock is declining, and its decline is accelerating in a way that is not proportional to what the consuming stock can see.
Meadows calls this the “overshoot”, the period during which the consuming stock exceeds the level the resource can sustainably support. In other words, the system is already past the sustainable point, but the consuming stock is still growing. It’s resembles a cartoon scene when the floor is gone, you are running on air, you just haven’t looked down yet.
This is why the cod fishery catch was still good the year before the collapse. The fishing fleet had exceeded the sustainable yield years earlier. The cod stock was already below its regeneration threshold. But the catch -the visible output, the number everyone watched- lagged the structural reality. Ironically, the “stop” signal arrived after the point where stopping would have helped.
The Implication
Overshoot and collapse is something very different than a basic failure of restraint. It is a structural outcome of a system where a reinforcing loop consumes a stock-dependent renewable resource faster than it regenerates. The collapse is fueled by the structure long before it becomes visible in the behavior which happens to be the “too late” phase most of the time.
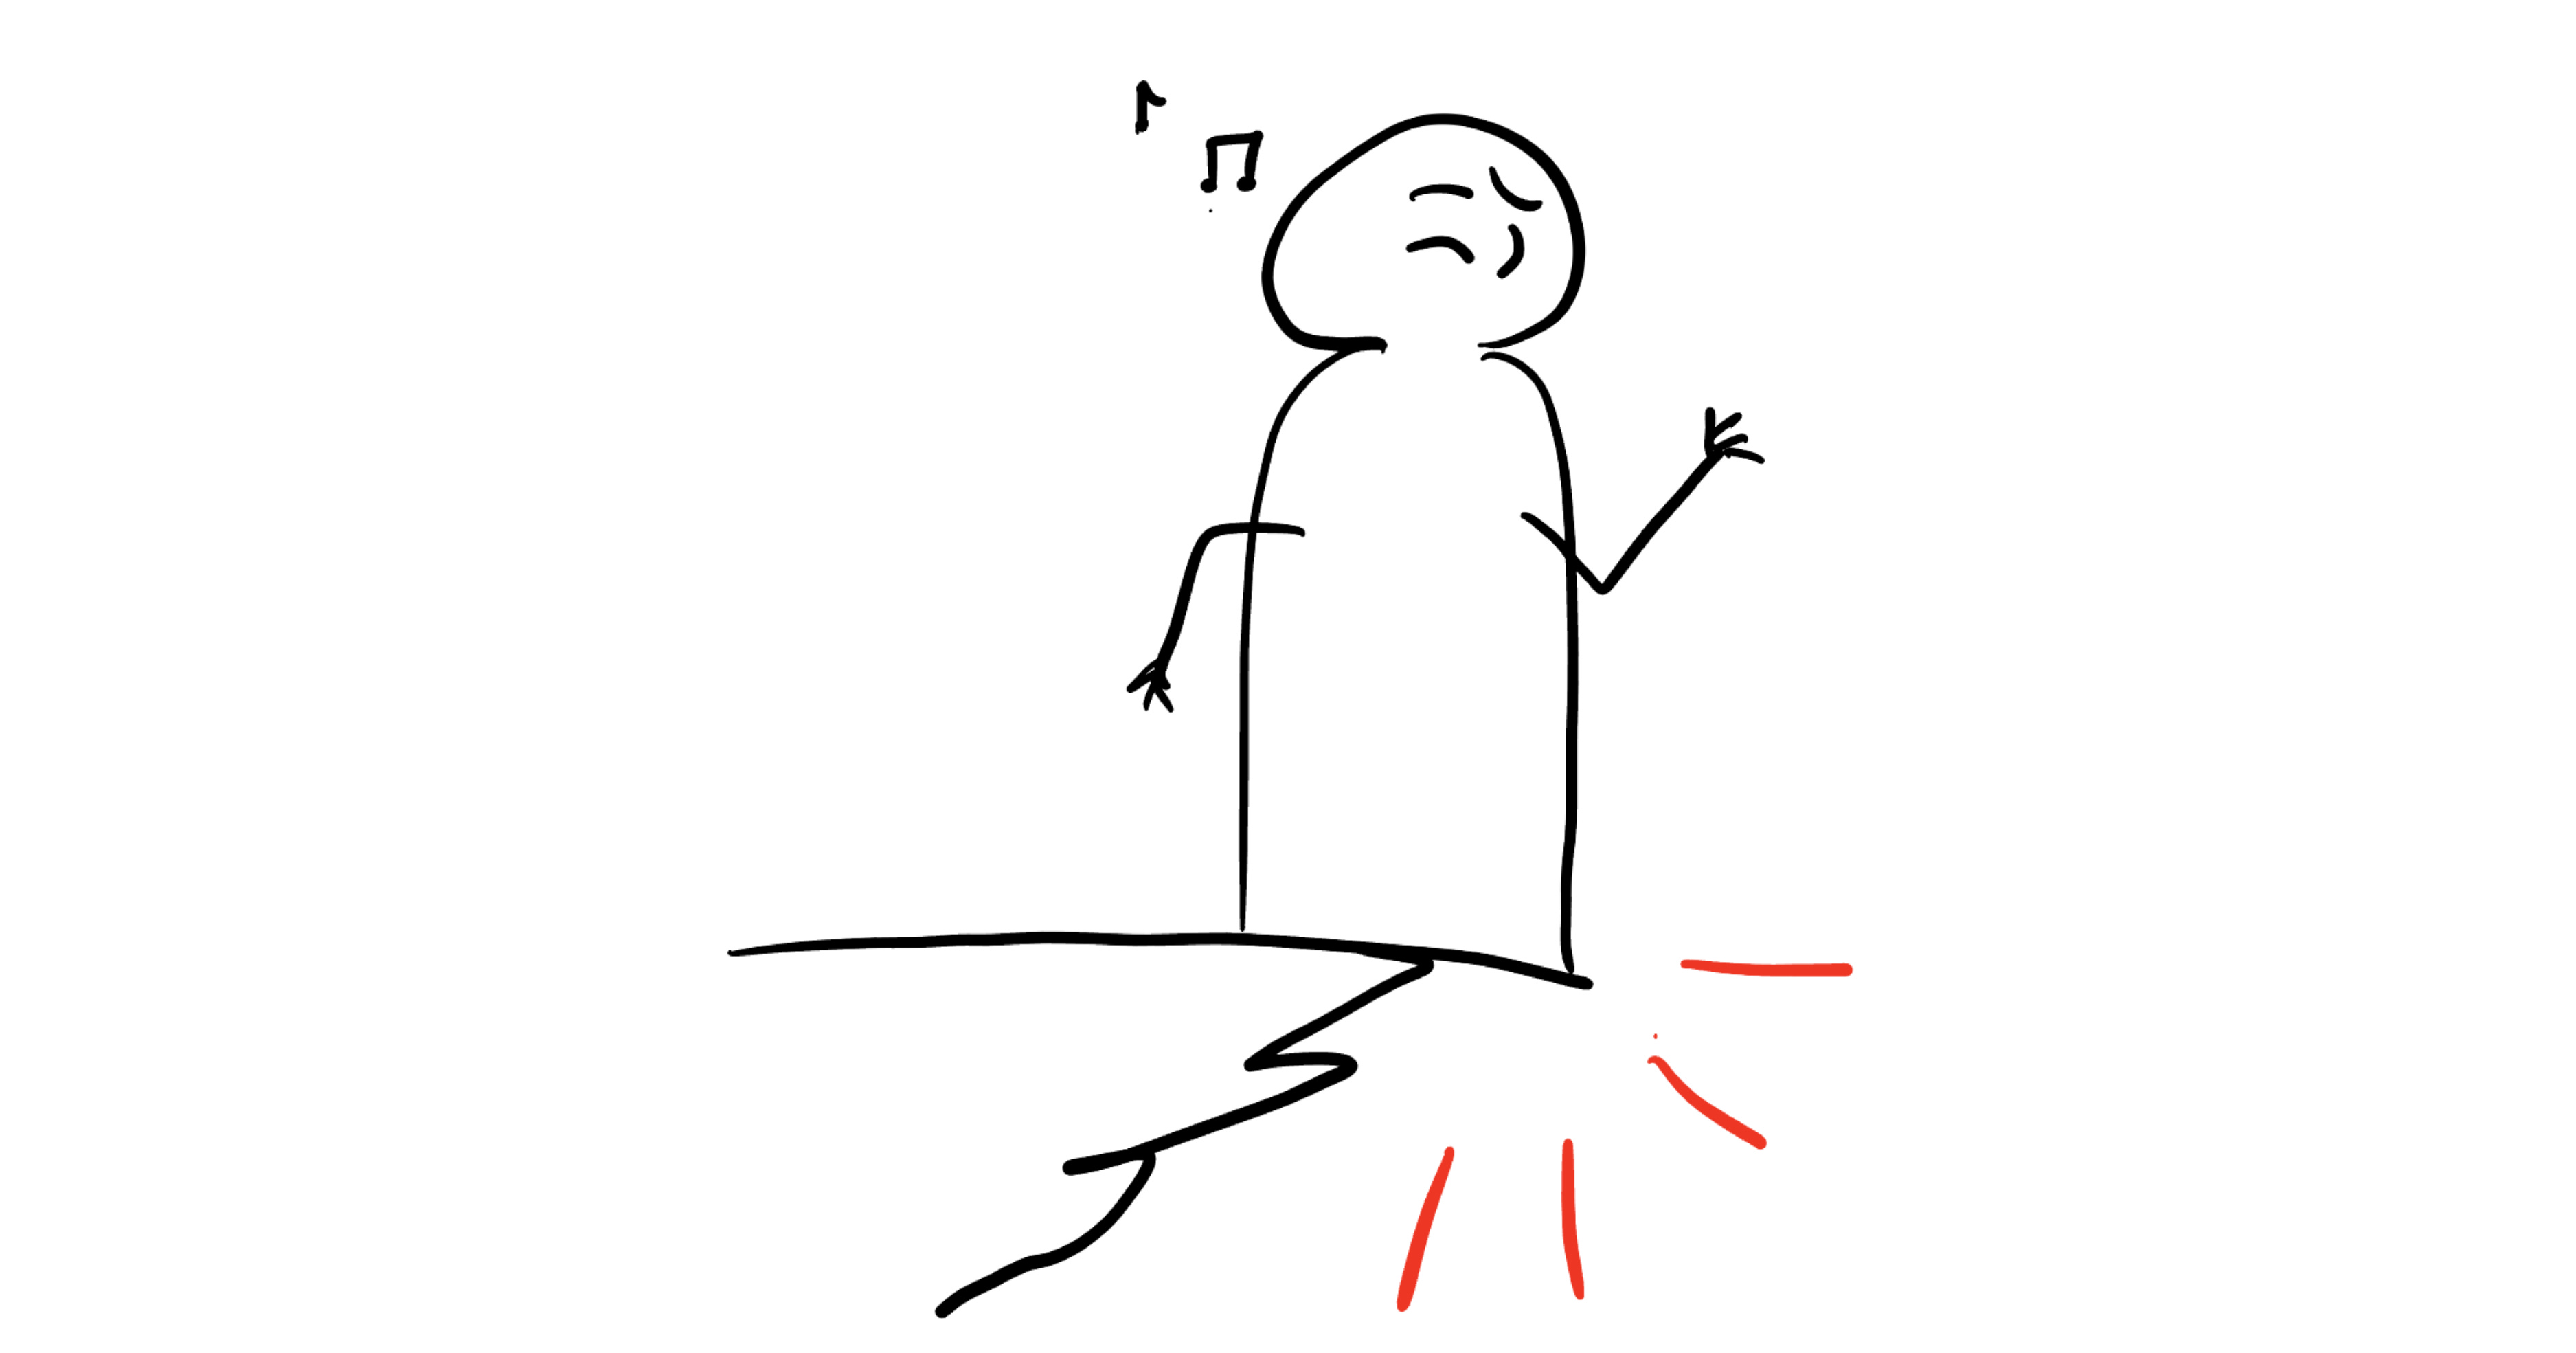
The intervention point is during the period that looks like success when the consuming stock is growing, the resource stock is still adequate, and every indicator says things are fine. That is when the floor can still hold weight, which means it can be saved. The point of intervention is not when things are at their worst. At that point, the resource base has gone past its regeneration threshold, and the path is set.
As an industrial engineer, it’s amusing to say, but the wrong lever is efficiency. Making the consuming stock more efficient at extracting the resource accelerates depletion. The right lever is the one that no one wants to pull when things are going well. In other words, limiting the growth rate of the consuming stock to stay within the resource’s ability to grow back.
This may be the hardest systems insight, acting on what you see while the system is still telling you everything is fine.
🧩 What’s Coming Next
This foundations series will build your systems thinking toolkit step by step:
2 | Stop! Let’s Talk Stocks: Not Wall Street, Just Bathtubs ✔️
3 | Go With the Flow: Pipes, Currents, and Traffic Jams (A Love Story) ✔️
4 | Causal Loop Diagrams 101: Stop Talking, Start Drawing ✔️
7 | Reinforcing Feedback Loops: Congratulations, You Made It Worse ✔️
10 | One-Stock System Dynamics: Choose Your Own Catastrophe ✔️
13 | Overshoot & Collapse: The System Ate Itself ✔️
14 | Exponential Growth & Collapse: Fine, Fine, Fine, Oh No
📚 Main Resources
Meadows, D. H. (2015). Thinking in Systems. Chelsea Green Publishing.
Sterman, J.D. (2000) Business Dynamics: Systems Thinking and Modeling for a Complex World. Irwin McGraw-Hill, Boston.
My lecture notes from “System Dynamics” and “Simulation” classes :)
Some explanations and phrasings closely follow or directly quote these sources. The text was refined for coherence and citation accuracy with the assistance of large language models.