

System Dynamics | Foundation 5: Stock-Flow Diagrams
The Other Diagram

A city planner stares at her causal loop diagram (CLD). She’s mapped the whole thing: population growth drives housing demand, construction drives available housing, available housing attracts more people. Reinforcing loop. Balancing side too: more people, more crowding, fewer people want to move in.
Her mayor asks: “If we approve 5,000 new units, what does the city look like in ten years?”
She looks at her CLD. It has no answer. It can tell her that more housing attracts more people. It cannot tell her how many, how fast, or whether infrastructure will keep up. It can show the loops. It can’t run them.
Stock-flow diagrams can. That’s the difference between understanding a system and predicting what it will do.
Building It Piece by Piece
Let’s not start with cold definitions. We’ll meet each element as we need it.
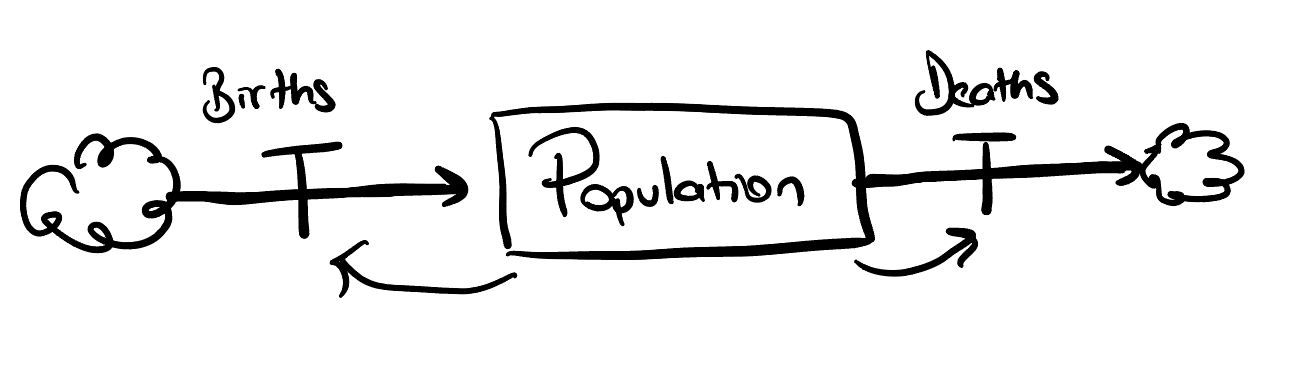
Start with one rectangle: Population. You know this from Foundation 2; a stock, an accumulation. Now attach two pipes: Births flowing in, Deaths flowing out. Familiar from Foundation 3, flows are the taps and drains.
But where do newborns “come from” in our model? Where do the dead “go”? We put “clouds” at both ends. A cloud says: “I’m not modeling what’s beyond this point.” Clouds have infinite capacity, they never run dry and never overflow.
If births exceed deaths, population grows and also population effects births as well. If deaths exceed births, it shrinks. But we haven’t said what controls the rates.
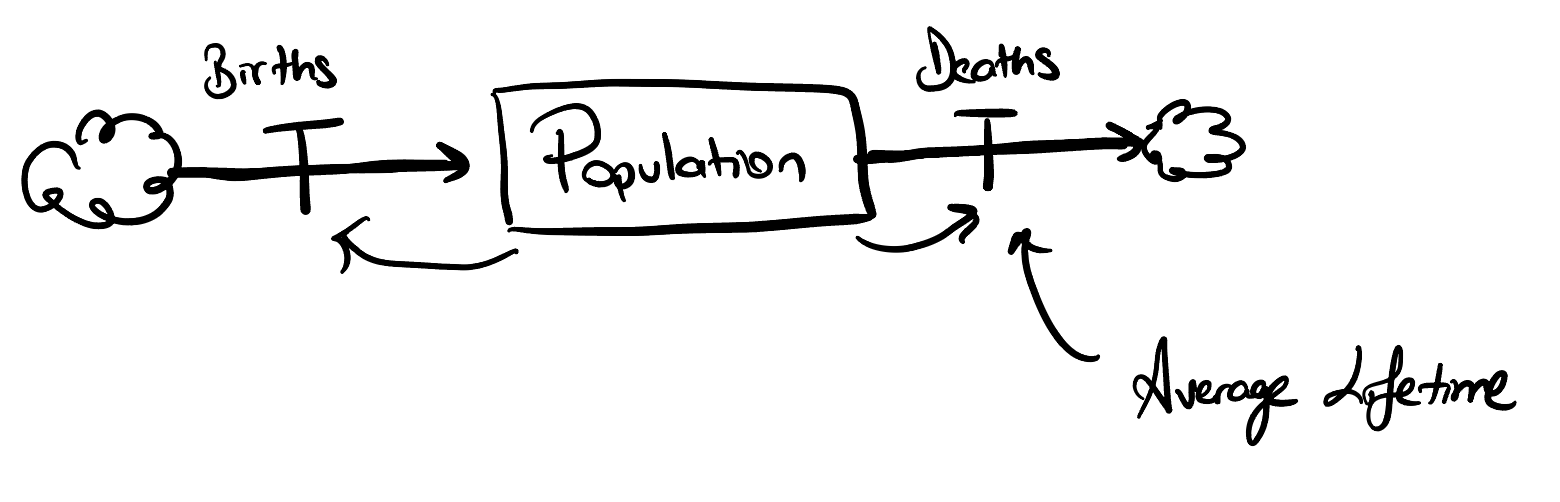
How fast do people die? That depends on Average Lifetime, a constant. It connects to Deaths, but not through a pipe. A thin arrow, a link, carries information. No physical material flows from “average lifetime” into “deaths.” The link says: the death rate reads the average lifetime and decides the draining rate form Population stock.
And on the Births and Deaths pipes sit a valve. Flows don’t just happen at arbitrary rates, something regulates them. Think faucet handle, not water. Here, the valve on Deaths is controlled by both Population and Average Lifetime.
Now it gets interesting.
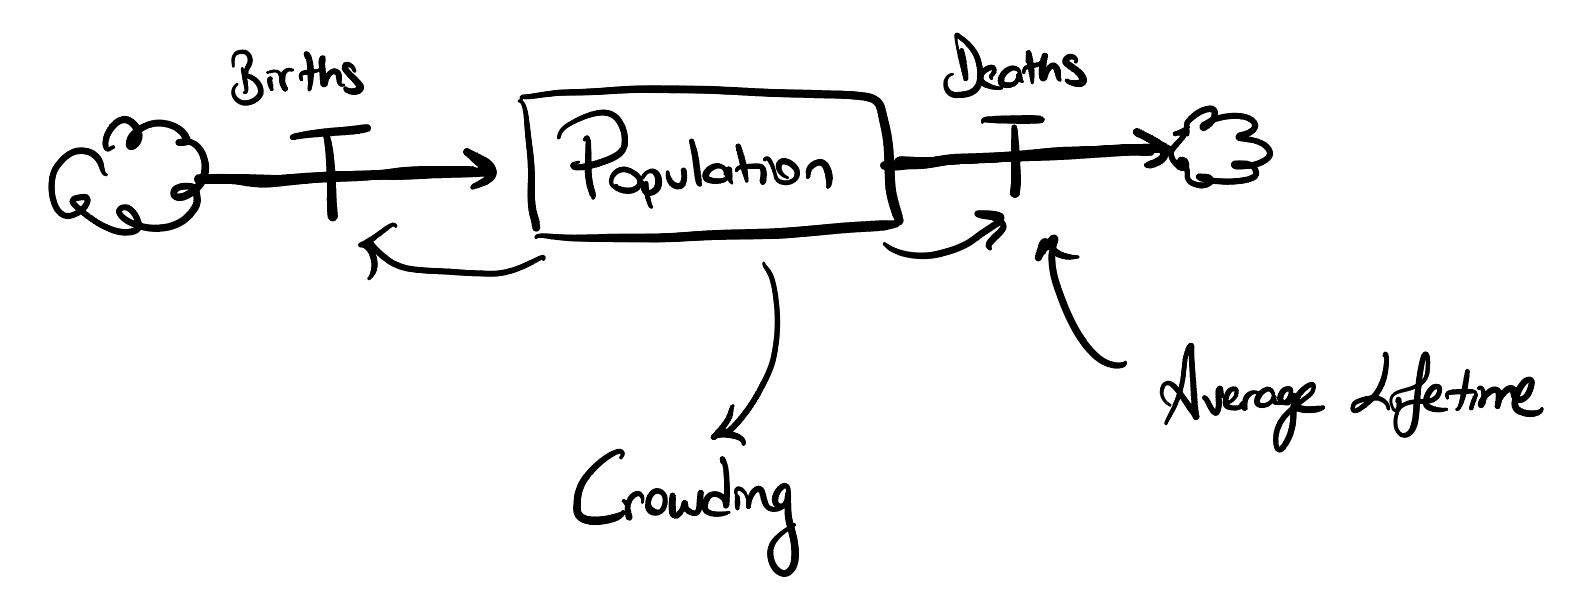
Crowding enters as an auxiliary variable, also called a converter. It’s not a stock and not a flow. It’s intermediate logic: a calculation that translates information from one part of the system into a form another part can use.
Population connects to Crowding via a link. As population grows, crowding increases. Notice: the stock is being read. People aren’t flowing into crowding. A census doesn’t remove people from the population. You can check your bank balance a hundred times without losing a cent. Links observe without consuming.
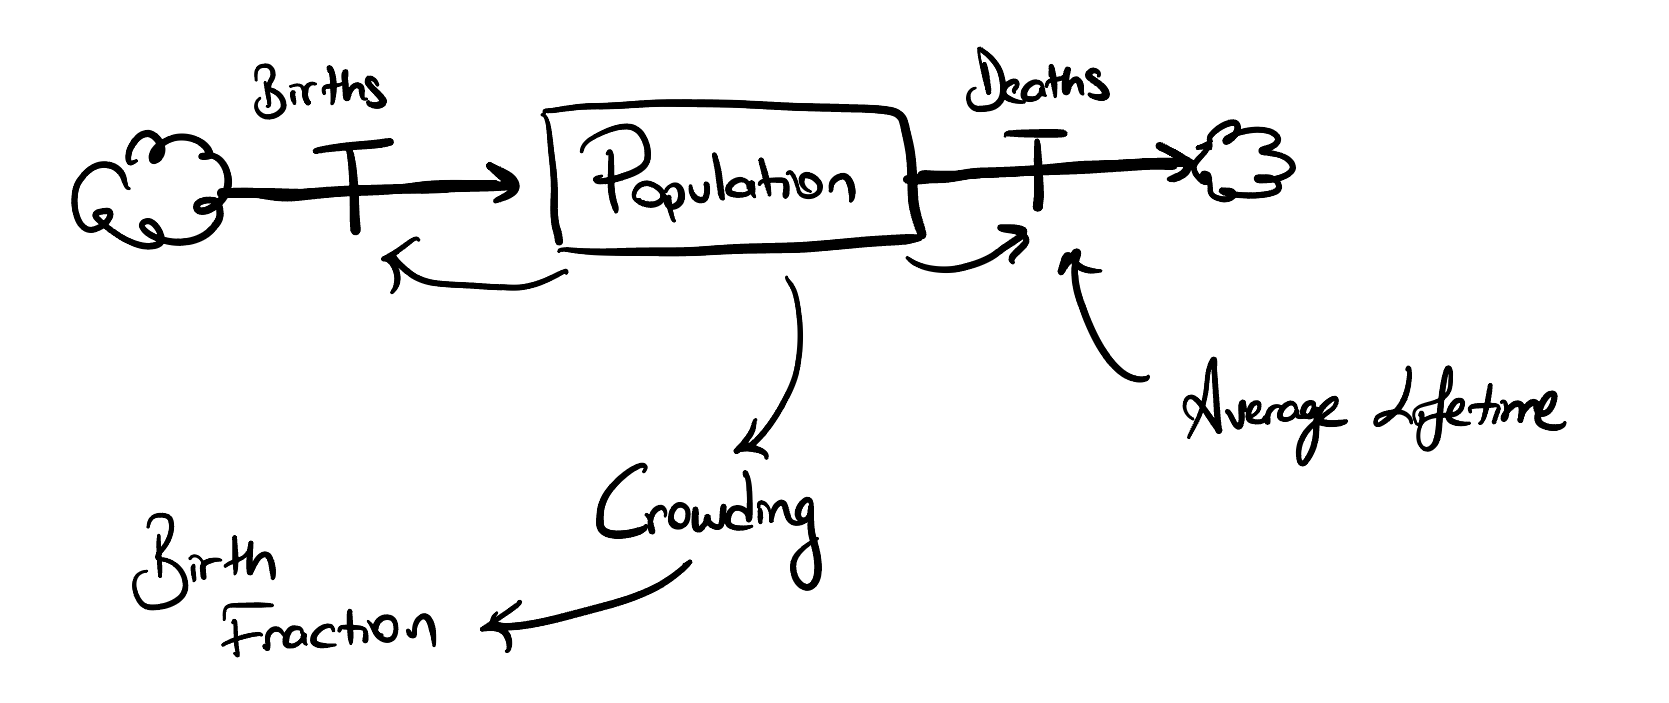
Birth Fraction is another auxiliary. Crowding connects to it, more crowding means lower birth fraction. Resources thin out, conditions deteriorate, people have fewer children. Birth Fraction feeds into the valve on Births.
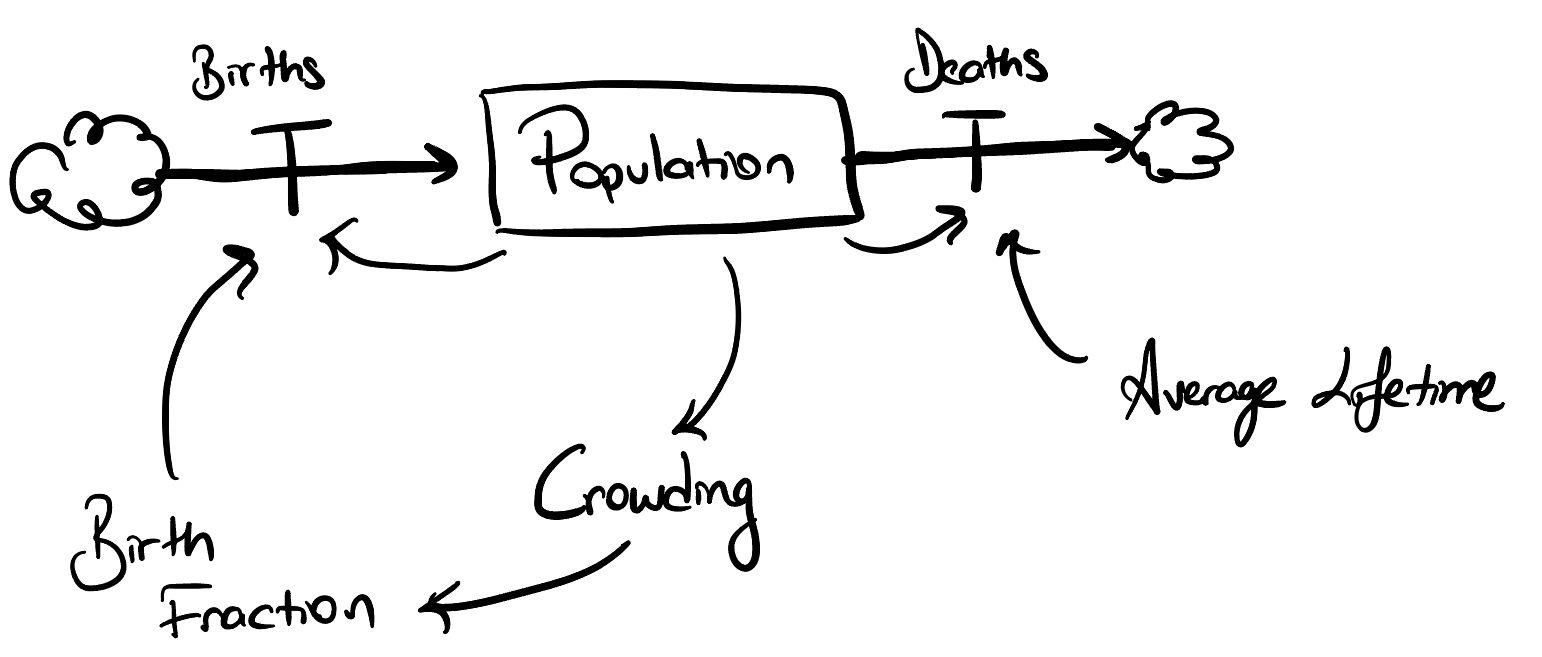
Step back. Population drives Crowding. Crowding drives Birth Fraction. Birth Fraction drives Births. Births change Population. The loop closes.
Unlike a CLD, we know exactly where the accumulation sits, which connections are physical flows and which are information, and what regulates each rate. We could plug in numbers and simulate the next hundred years (wait for the next weeks:).
From mapping to modeling.
The Six Elements
Now that you’ve seen them in action, here they are together:
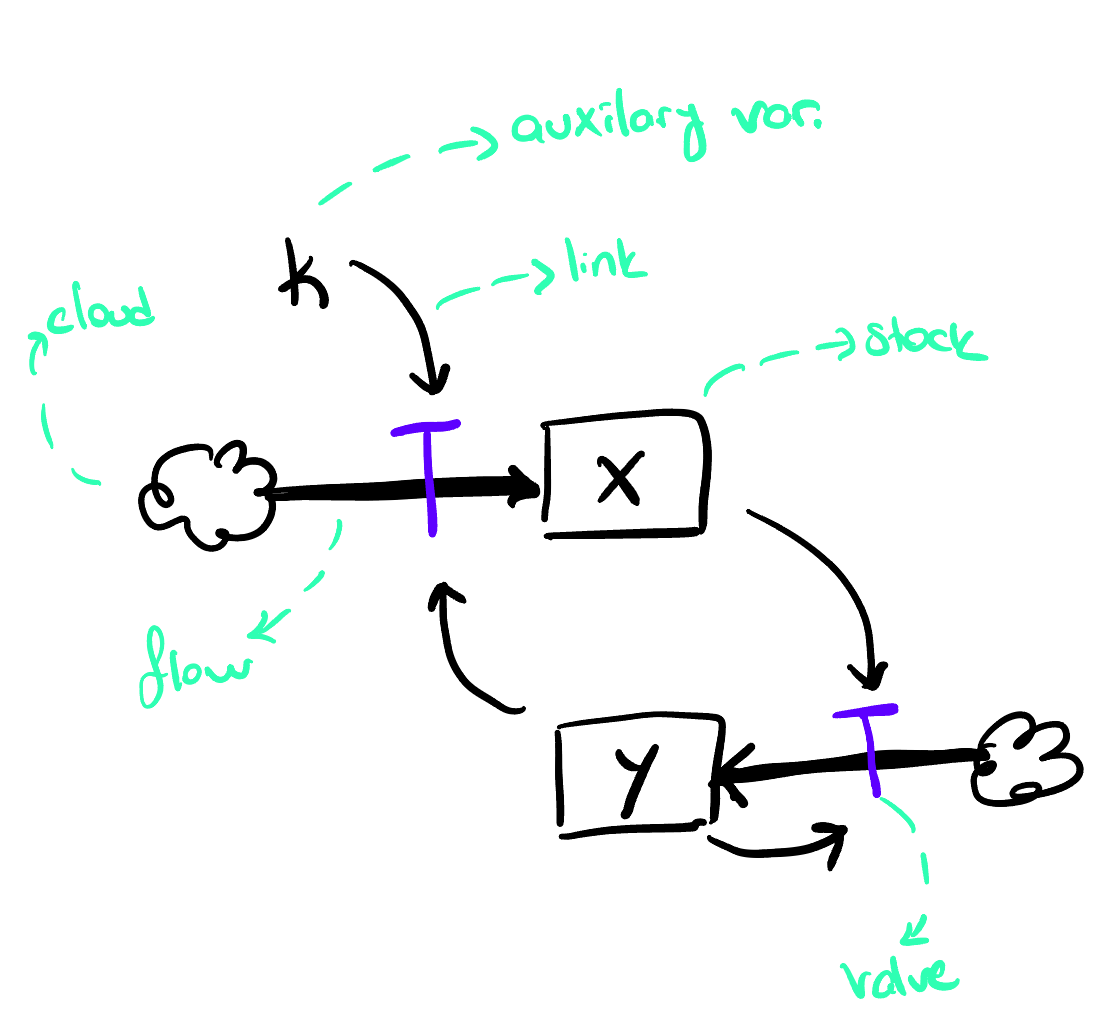
Stock-flow diagrams have six elements.
Stocks are rectangles. You met them in Foundation 2, they’re the bathtubs. Accumulations. The state of the system right now. Population, inventory, savings, reputation. Whatever you can measure at a single point in time.
Flows are pipes with arrows pointing into or out of a stock. Foundation 3 covered these, the taps and drains. Births, purchases, spending, forgetting. Whatever changes a stock over time.
Valves sit on the flows. This is new. Flows don’t just happen at arbitrary rates, something regulates them. A valve represents whatever controls how fast a flow runs. Think of the faucet handle, not the water. A hiring policy is a valve on the flow of new employees. An interest rate is a valve on the flow of borrowing.
Clouds sit at the ends of flows, at the edges of your diagram. They represent sources and sinks, wherever flows come from or drain into outside the boundary of your model. A cloud says: “I’m not modeling what’s beyond this point.” The cloud feeding a birth flow assumes there’s always a potential for new births. The cloud absorbing a death flow assumes dead people leave the system entirely. Clouds have infinite capacity. They never run dry and never overflow. We’ll come back to why that assumption matters.
Auxiliary variables (also called converters) are the in-between calculations. Not everything in a system is a stock or a flow. Some things are intermediate logic, they translate information from one part of the system into a form that affects a flow. Think of them as the reasoning step between “what is” and “what happens next.”
Links are thin arrows that carry information. Not material. Not people. Not money. Nothing physical moves along a link. A link says: “this variable reads that variable.” This is the single most important distinction from a causal loop diagram, where every arrow looks identical. In a stock-flow diagram, you can immediately see what’s a physical flow and what’s just information. That clarity isn’t cosmetic. It prevents errors.
Six elements. Every stock-flow diagram you’ll ever encounter is built from these.
Pipes vs. Wires
In a CLD, “Births → Population” and “Population → Crowding” look identical, arrows with polarity signs. But one is a physical flow of human beings and the other is information being observed. One is a pipe. The other is a wire.
Physical flows are conserved. What flows in must flow out or accumulate. Population today = Population yesterday + Births − Deaths. No exceptions.
Information flows have no such constraint. Information can be read by multiple parts of the model simultaneously without being depleted.
Auxiliaries: One Idea, One Box
You could collapse Crowding and Birth Fraction into a single equation connecting Population directly to Births. Mathematically identical. But then no one can see the reasoning.
With explicit auxiliaries, a colleague can point to Crowding and say “I agree population affects crowding” but point to Birth Fraction and say “I don’t think crowding affects births this directly, I think it works through food supply.” That’s a productive disagreement that improves the model.
Each auxiliary should represent one clear idea. If you need a paragraph to explain what it calculates, break it into two.
Challenging the Clouds
Those clouds at the edges? They’re the most important things you’re not looking at.
The cloud feeding Births assumes infinite potential for new births. The cloud absorbing Deaths assumes the dead leave the system entirely. What if the dead decompose, fertilize land, grow food, and that food supports more births? Then the cloud should be a stock, connected back into the system. What you thought was a boundary is actually a hidden feedback loop.
Barry Richmond called this “challenging the clouds.” Three questions for every cloud:
Can this source run dry? A cloud feeding new hires assumes infinite talent supply. Realistic in a small town?
Can this sink back up? A cloud absorbing waste assumes infinite disposal capacity. What happens when landfills fill?
What feedbacks am I cutting off? Every cloud is where you decided the world ends. Sometimes that’s reasonable. Sometimes you’ve excluded the loop that explains everything.
The same applies to constants. Average Lifetime is frozen in our model, but what if an epidemic changes it? Every constant is a cloud in disguise: a variable you’ve decided not to model. Clouds and constants won’t always be wrong. But they should never be invisible decisions.
👋🏽 Before You Go
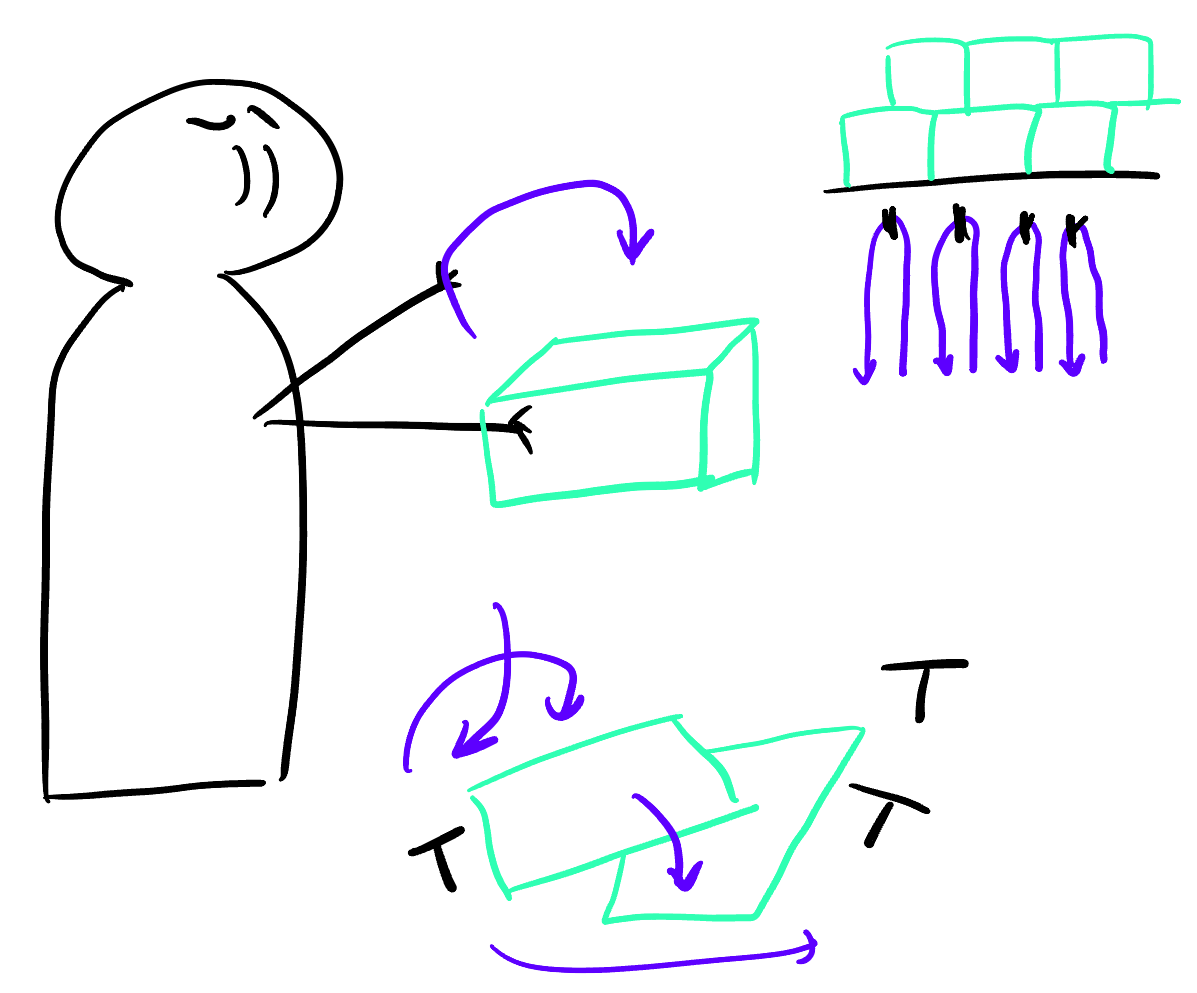
You pour a cup of coffee. It’s hot, much hotter than the room. You set it on your desk and forget about it. An hour later, lukewarm. Eventually, it matches room temperature and stops changing.
This is Newton’s Law of Cooling. The elements are: Coffee Temperature, Heat Loss, Room Temperature, Discrepancy (the gap between coffee and room temperature), and a Cooling Rate.
What’s the stock? What’s the flow? Which are auxiliaries, which is a constant? Where would you draw clouds?
And the real question: what type of feedback loop is this? As coffee cools, the discrepancy shrinks. As discrepancy shrinks, heat loss slows. The coffee approaches room temperature but never crashes into it, it asymptotes. The system regulates itself toward a goal.
If you can build the stock-flow diagram for this, you understand the toolkit.
🧩 What’s Coming Next
This foundations series will build your systems thinking toolkit step by step:
This foundations series will build your systems thinking toolkit step by step:
2 | Stop! Let’s Talk Stocks: Not Wall Street, Just Bathtubs ✔️
3 | Go With the Flow: Pipes, Currents, and Traffic Jams (A Love Story) ✔️
4 | Causal Loop Diagrams 101: Stop Talking, Start Drawing ✔️
📚 Main Resources
Meadows, D. H. (2015). Thinking in Systems. Chelsea Green Publishing.
Sterman, J.D. (2000) Business Dynamics: Systems Thinking and Modeling for a Complex World. Irwin McGraw-Hill, Boston.
My lecture notes from “System Dynamics” and “Simulation” classes :)
Some explanations and phrasings closely follow or directly quote these sources. The text was refined for coherence and citation accuracy with the assistance of large language models.