

System Dynamics | Foundation 12: Two-Stock Systems
Now There Are Two of Them

We are generally talking about systems, which surprises people when they are able to spot them and their dynamics. Population health and epidemics are not different. There are thousands of researchers who simulate population dynamics with our basic foundational elements to foresee the future of potential scenarios and develop strategies for each. To introduce two-stock systems, we’ll make a short visit to the epidemics world and borrow one of the beginner examples called the SI model.
Before diving into the mechanics and graphs, I want to explain what I am referring to as a two-stock system.
What Makes It a Two-Stock System
Up to now, every system in this series has had one stock. One accumulation, pulled by flows, shaped by feedback. We got a surprising amount of behavior out of that such as goal-seeking, exponential growth, oscillation, dominance shifts. All from a single stock and its loops.
A two-stock system is not just “two of those next to each other.” If I put two bathtubs in a room and each has its own faucet and drain, I have two one-stock systems sharing a bathroom. Without something connecting them, each behaves independently.
The structural shift happens when a flow depends on both stocks at the same time. When the rate of flow into one stock is a function of the level of the other stock, the two become coupled. Neither can change without affecting the other. That coupling, that shared dependency, is what makes a two-stock system a system rather than two separate problems drawn on the same page.
The SI model is a clean, minimal example of this. Let me walk through it.
The SI Model
The Setup
We have a closed population of 10,000 people and two stocks.
Susceptible (S): people who have not yet been infected. Starts at 9,999.
Infected (I): people currently infected. Starts at 1.
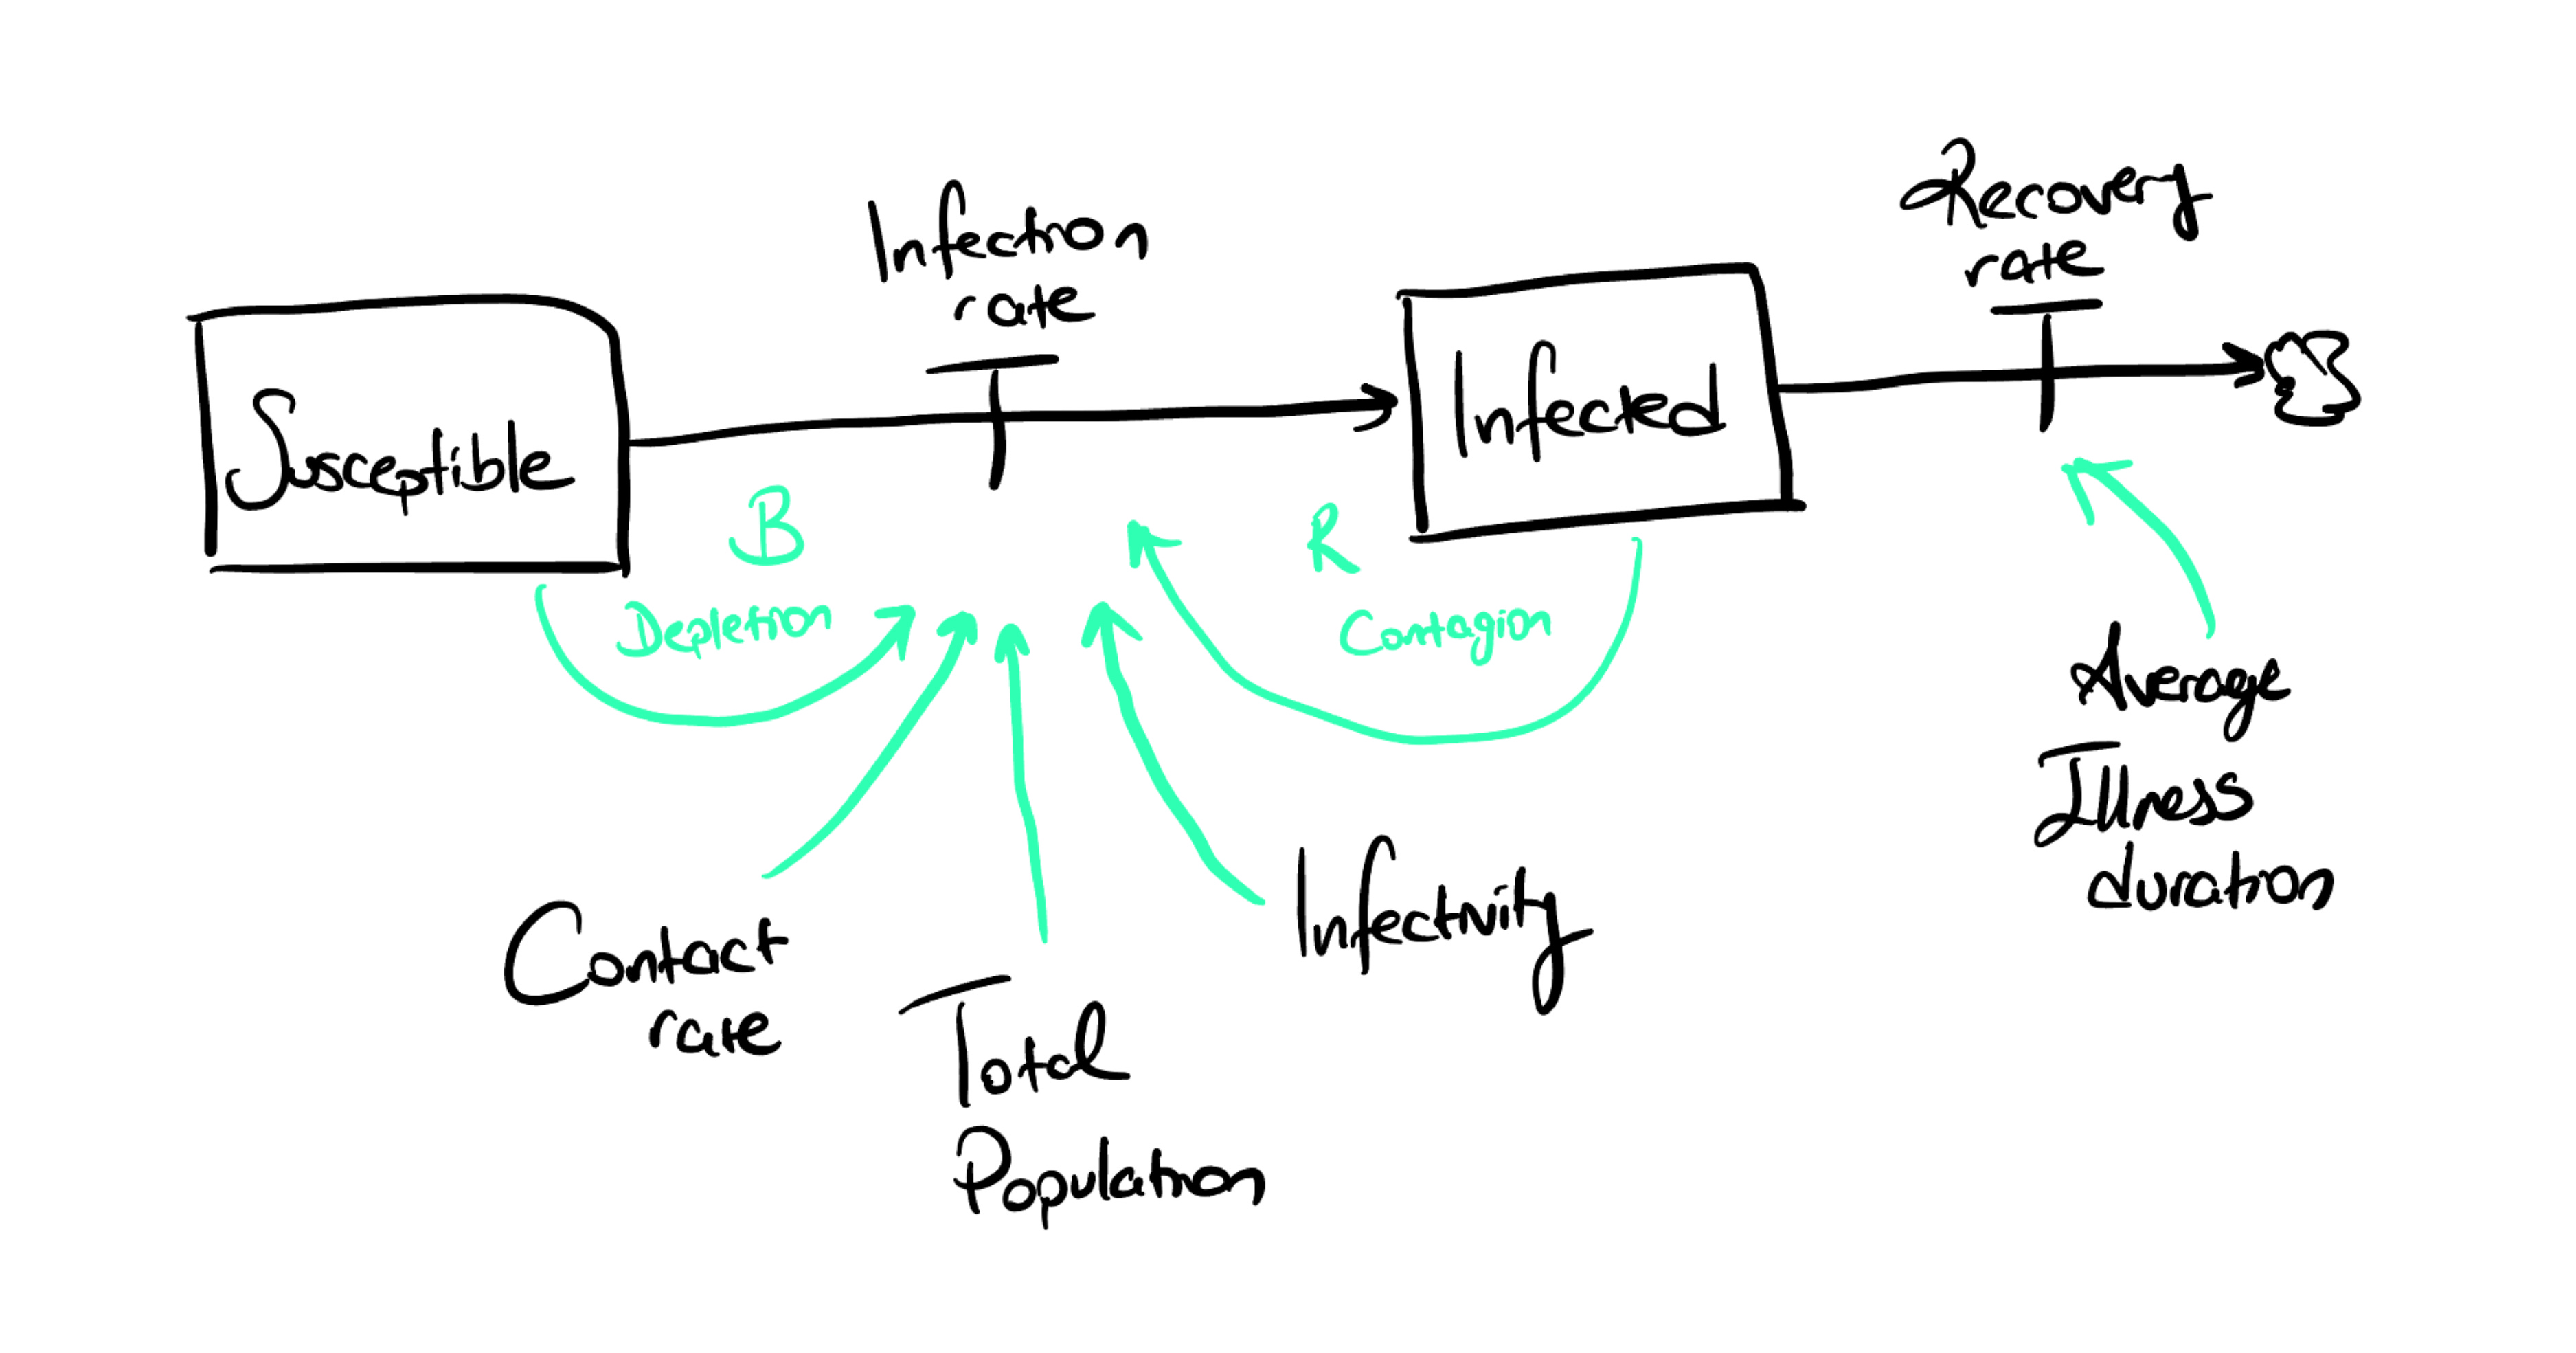
One flow connects them. The Infection Rate moves people from Susceptible to Infected, it is simultaneously an outflow from S and an inflow to I. One flow, serving two stocks.
Four quantities govern the infection rate:
Contact Rate: how many people each person contacts per day.
Infectivity: the probability that a contact between a susceptible and an infected person results in transmission.
I / Total Population: the fraction of contacts that are actually with infected individuals.
S: the number of susceptible people available to be infected.
Multiply them together:
Infection Rate = Contact Rate × Infectivity × (I / Total Population) × S.
Notice what sits inside that equation: both S and I. The flow cannot operate without both stocks contributing to its rate, that is what we called the coupling.
We have one more flow, called the Recovery Rate that drains Infected.
Recovery Rate = I / Average Duration of Infection.
This one depends on I alone. Recovered individuals leave the system and play no further role.
Now let’s run it.
One infected person among 9,999 susceptible. The infection rate is nearly zero. The main reason is not the fact that the virus needs warming up as you intutively guessed. The dominat reason is that the term I/Total Population is near zero, and that suppresses the entire product. So, epidemics start slow for structural reasons.
As I grows, I/Total Population rises. More contacts become infectious. Each new case raises the fraction, which raises the infection rate, which produces more cases. Foundation 7’s reinforcing loop, running clean.
If S were not moving, we would project exponential growth forever.
But every person added to I was subtracted from S. When I reaches 5,000, S has also fallen to 5,000. The product S × I -the coupling term- peaks when the two stocks are equal. Past that crossing, further increases in I are more than offset by decreases in S. The curve bends. Nobody intervened. The flow consumed the resource it was feeding on.
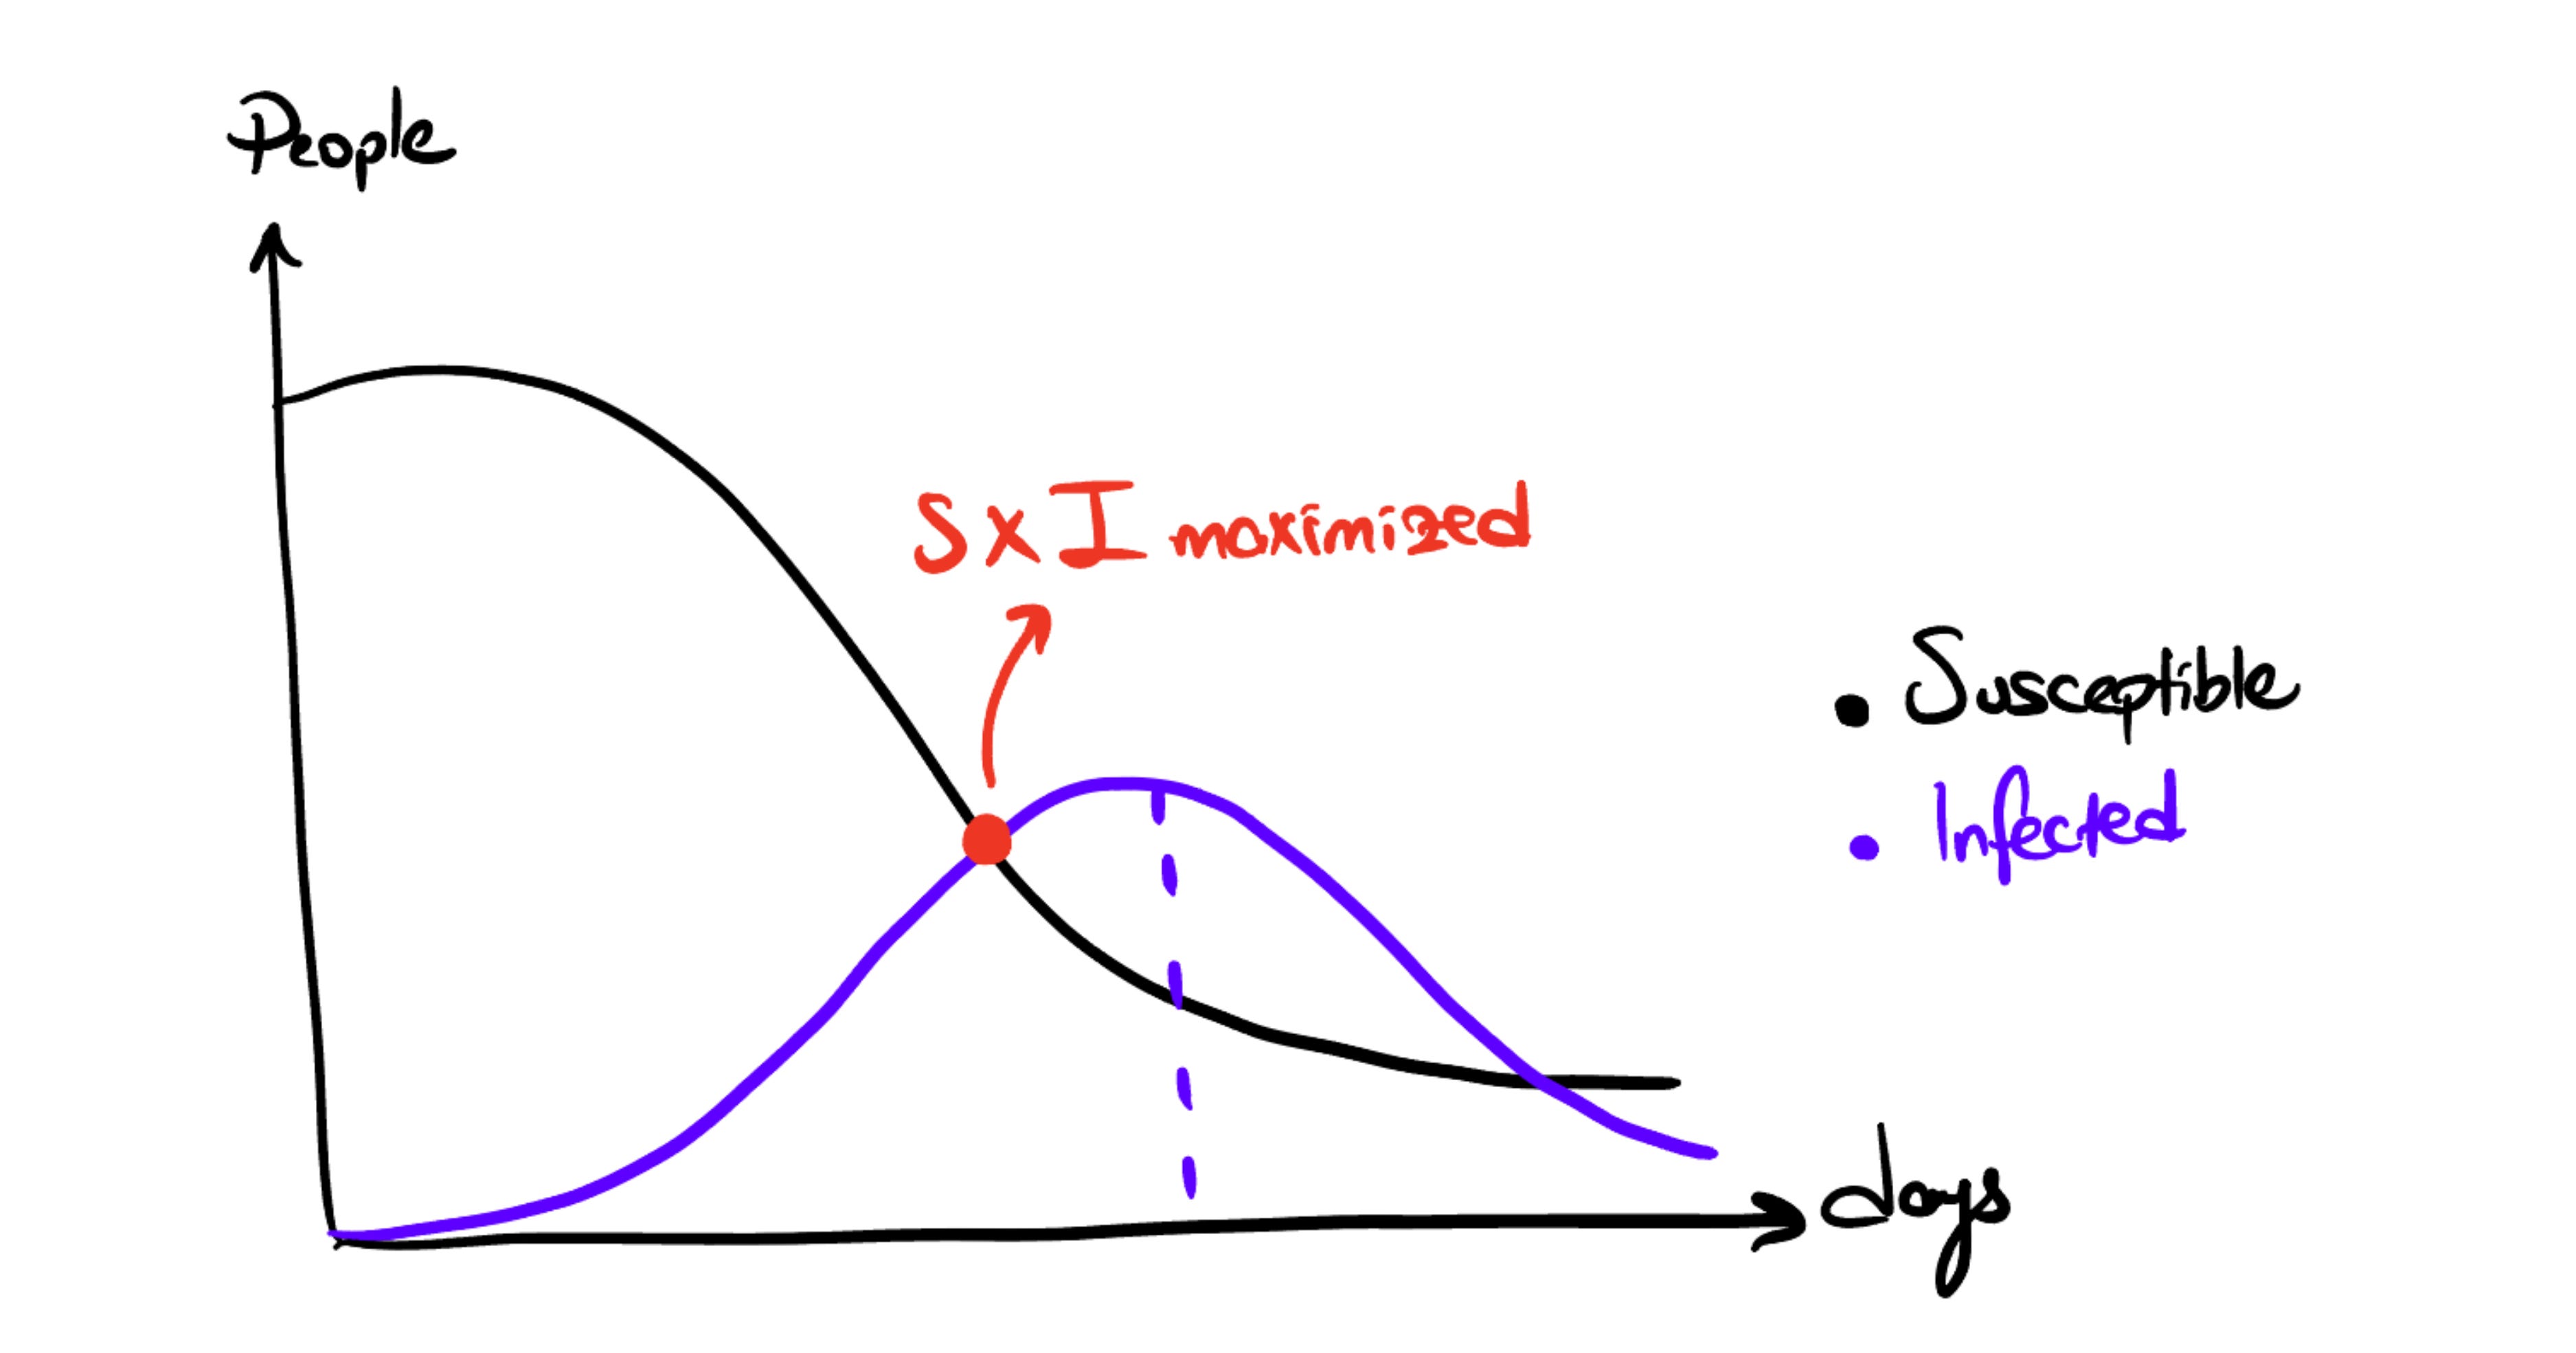
Past the peak, new infections arrive more slowly than recoveries remove them. The infection rate depends on both S and I, and S is now small. The infected stock falls, because the susceptible pool driving transmission has been depleted.
There are now so few susceptible people left that the spread cannot continue; in other words, if you are immune to the disease, you prevent the number of susceptible people from rising again. This is how an epidemics naturally dies out.
The Mechanics: What Coupling Actually Does
Let me state this precisely.
A two-stock system contains two stocks connected by flows, where at least one flow depends on both stocks simultaneously. That shared dependency is coupling, the feature that makes the system irreducible to two separate one-stock analyses. It happens when a flow depends on multiple stocks, no single stock controls its own trajectory.
Our SI model has the minimal coupling configuration:
Transfer flow (Infection Rate): simultaneously an outflow from one stock and an inflow to the other, with a rate equation containing both stock values.
Drain flow (Recovery Rate): depends on one stock only (e.g. I alone)
The transfer flow is what makes this a coupled system. Remove S from the infection rate and let it depend on I alone, and you have two decoupled one-stock problems. S drains, I grows then decays. The epidemic hump vanishes, replaced by exponential rise followed by exponential fall, shapes we already catalogued in Foundation 10.
The coupling term S × I is a nonlinear interaction. Not S plus I, the behavior comes from S times I. The product peaks when both stocks are moderate and collapses when either approaches zero. The infection rate accelerates, peaks, and declines with no parameter change and no delay. Structure alone generates the shape.
In Meadows’ vocabulary: the infection rate is governed by a reinforcing loop (more I → more infection) simultaneously constrained by the depletion of S. That constraint operates through the coupling, again be careful, not through a separate corrective loop acting on I. One stock’s accumulation is the other’s depletion, and the flow depends on both.
A useful diagnostic: if every flow in a system depends on only one stock, the stocks are co-located, not coupled. Two one-stock systems sharing a diagram, not a two-stock system.
The hump shape of I over time is the behavioral signature of this structure, what I’ll call a resource-coupled two-stock system. Four phases, each following directly from the coupling:
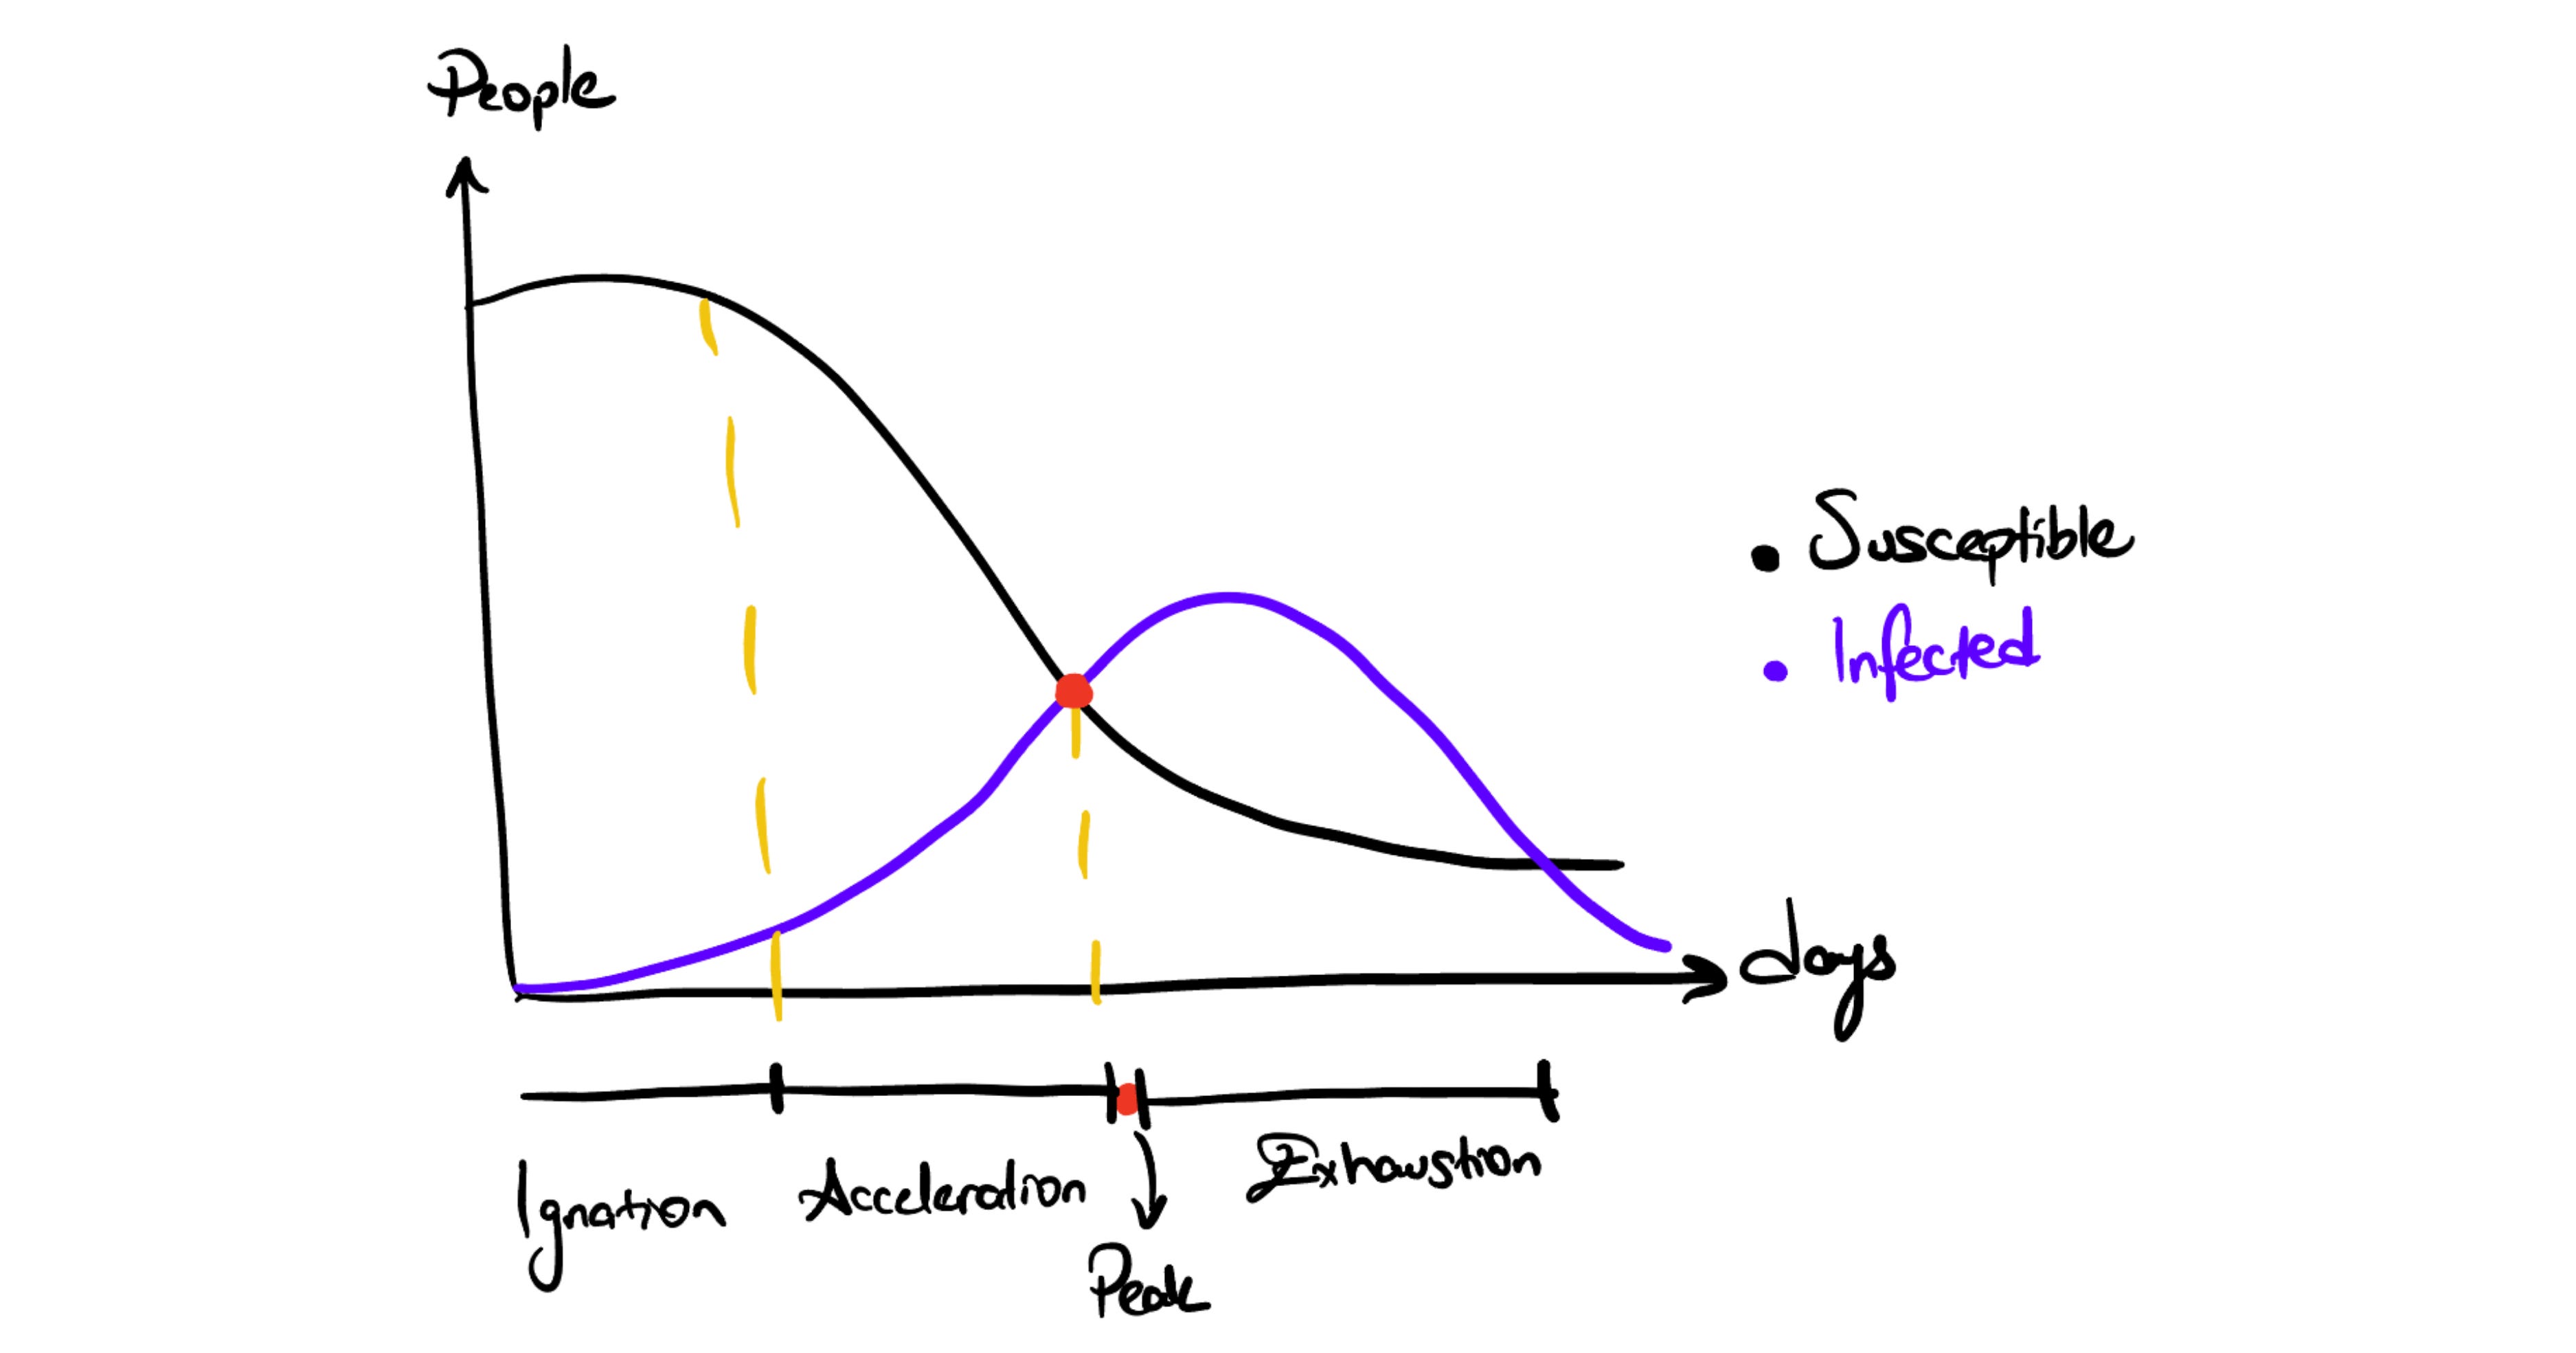
Phase 1 Ignition: S large, I small. Coupling flow weak. Growth slow.
Phase 2 Acceleration: I growing, S barely diminished. Coupling flow increasing rapidly. Behavior looks exponential. Projections based on this phase overestimate badly.
Phase 3 Peak: S depleted enough to stall the coupling flow. Maximum flow at maximum S × I. Resource depletion begins to dominate.
Phase 4 Exhaustion: S largely consumed. Coupling flow weakens toward zero. I declines under the recovery drain. The system settles.
This pattern appears wherever the structure appears. We can model many different things in the same way such as rumor through people who haven’t heard it, a product adopted from a finite pool of buyers, a fire through unburned forest. The stocks change names only while coupling and dynamics stay.
Visit this website for more and detailed health models!
The Implication
For eleven articles, every behavior we studied emerged from one stock and its flows. Reinforcing, balancing, dominance, delays… The stock governed itself through its own feedback.
When we add one more stock, then the system acquires something new. A flow that depends on both stocks means neither stock’s future is determined by its own feedback alone. In other wrods, each trajectory depends on what the other stock is doing.
I am not telling adding stocks adds complexity, it multiplies it (yeah, some wordplay). One-stock analysis tries to answer that what feedback structure governs this flow. But two-stock analysis requires a second question as what is the other stock doing to the flows on this one.
The SI model is the simplest possible coupled system. Two stocks, one coupling flow, one drain. And even this minimal configuration produces a behavior, the epidemic hump, that no one-stock system can generate. Be sure of that no arrangement of reinforcing and balancing loops on a single stock produces a curve that accelerates, peaks, and declines with no parameter change and no delay. That shape comes only from two stocks talking through a shared flow.
In short, one stock is a protagonist and two stocks is a relationship.
🧩 What’s Coming Next
This foundations series will build your systems thinking toolkit step by step:
2 | Stop! Let’s Talk Stocks: Not Wall Street, Just Bathtubs ✔️
3 | Go With the Flow: Pipes, Currents, and Traffic Jams (A Love Story) ✔️
4 | Causal Loop Diagrams 101: Stop Talking, Start Drawing ✔️
7 | Reinforcing Feedback Loops: Congratulations, You Made It Worse ✔️
10 | One-Stock System Dynamics: Choose Your Own Catastrophe ✔️
12 | Two-Stock Systems: Now There Are Two of Them ✔️
13 | Overshoot & Collapse: The System Ate Itself
📚 Main Resources
Meadows, D. H. (2015). Thinking in Systems. Chelsea Green Publishing.
Sterman, J.D. (2000) Business Dynamics: Systems Thinking and Modeling for a Complex World. Irwin McGraw-Hill, Boston.
My lecture notes from “System Dynamics” and “Simulation” classes :)
Some explanations and phrasings closely follow or directly quote these sources. The text was refined for coherence and citation accuracy with the assistance of large language models.